


Trend analysis (Fig. 1).
The price from the support line may begin to move up today with the target of 1.3117, the pullback level of 38.2% presented in a red dashed line. If this line is reached, continue to work up with the target of 1.3149, the pullback level of 50.0% presented in a red dashed line.
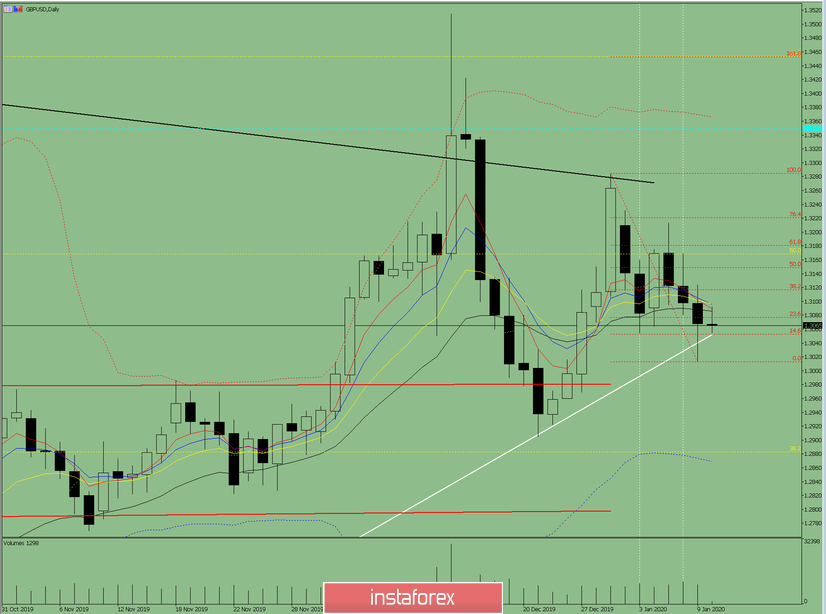
Fig. 1 (daily chart).
Comprehensive analysis:
- Indicator analysis - up;
- Fibonacci levels - up;
- Volumes - up;
- Candlestick analysis - the top;
- Trend analysis - up;
- Bollinger Lines - up;
- Weekly schedule - up.
General conclusion:
The price may begin to move up today.
An unlikely scenario is from the level 1.3049, the support line presented in a white bold line, work down with the target of 1.3013, the lower fractal presented in a red dashed line.


