


Trend analysis (Fig. 1).
The price opened with a lower gap below the support line 1.3065 presented in a white bold line. The said line will be the watershed for today. Also, the price may begin to move up with the target of 1.3117 which is a pullback level of 38.2% presented in a red dashed line. If this line is reached, a continuation of work up with the target of 1.3149 which is a pullback level of 50.0% (presented in a red dashed line.
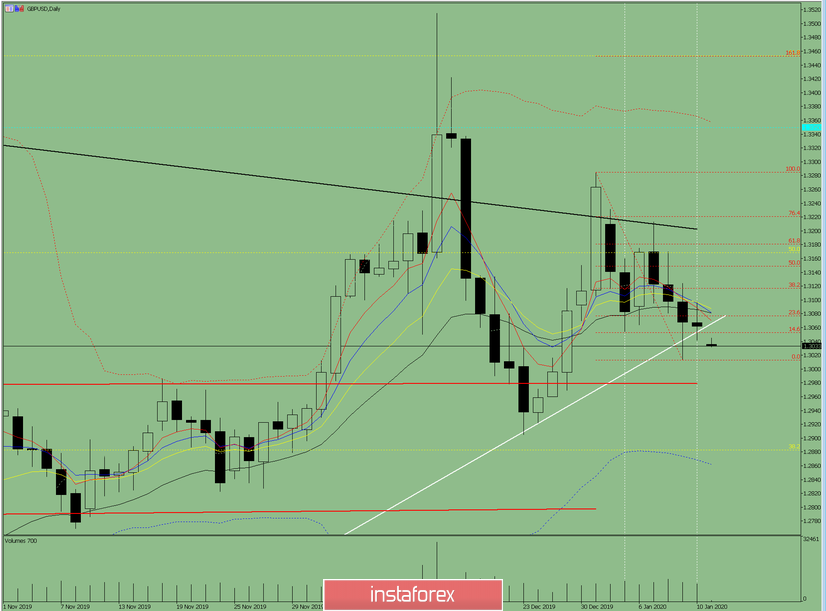
Fig. 1 (daily chart).
Comprehensive analysis:
- Indicator analysis - up;
- Fibonacci levels - up;
- Volumes - up;
- Candlestick analysis - up;
- Trend analysis - up;
- Bollinger Lines - up;
- Weekly schedule - up.
General conclusion:
The price may start to move up today.
A downward scenario is unlikely but quite possible. From the level of 1.3053, the support line in a white bold line, work down with the target 1.3013, the lower fractal presented in a red dashed line.


