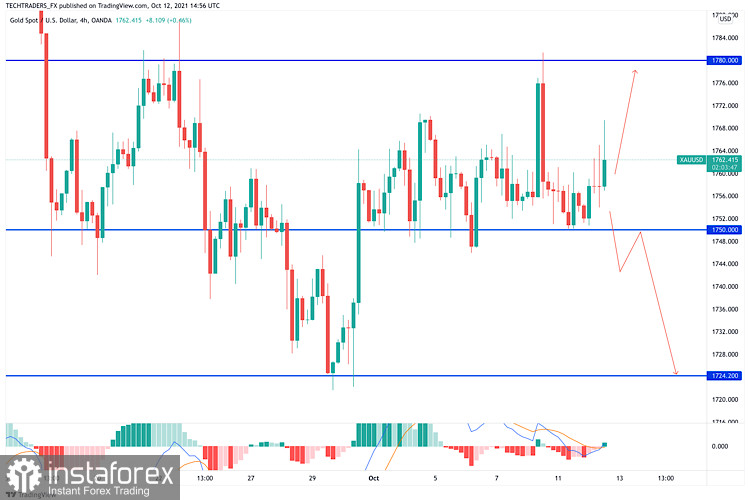
Gold advanced beyond $1,760 during the European trading hours but reversed its direction with the greenback starting to outperform its major rivals. However, the 10-year US Treasury bond yield is down more than 1.5% on the day, helping XAU/USD limit its losses for the time being.
Gold is moving back and forth, without a clear directional bias, with a bunch of healthy barriers stacked up in either direction.
Immediate upside is capped at $1,762, which is the convergence of the Bollinger Band one-hour Upper and the previous day's high.
The next significant topside hurdle is seen at $1,765, where the Fibonacci 38.2% one-month aligns.
The Fibonacci 61.8% one-week at $1,767 will then challenge the bearish commitments.
Gold bulls need to find acceptance above the pivot point one-day R3 at $1,771 to initiate a meaningful uptrend.
Alternatively, gold buyers will once again challenge bids at $1,755, the convergence of the one-week Fibonacci 23.6% and one-day Fibonacci 38.2%.
A sustained move below the latter will expose the $1,750 psychological level, below which the next downside target at $1,748 could get tested. That level is the one-month Fibonacci 23.6%.
The next cushion appears around $1,745, where the previous week's low intersects the one-day pivot point S2.
The one-week pivot point S1 at $1,741 will be the level to beat for gold bears.


