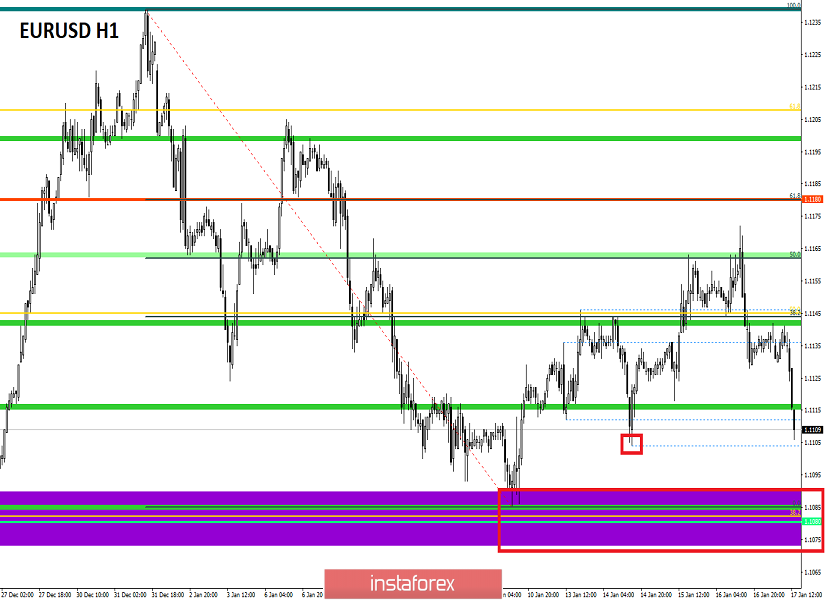
Using complex analysis, we can see that the correction phase from the range of 1.1080 reached its local peak. This was located near the level of 1.1180. Since Wednesday, the correction has been under pressure, confirmed by a temporary lateral movement, and the structure of which there were impulses, locally reaching the area of the control level with shadows. The amount of the change in the correction was much larger than initially considered, which is more than 50% relative to the downward movement since the beginning of the year.
Because of this, traders are not losing faith in the resumption of the downward trend, snd considers the recent correction as a kind of a variable component that does not carry a fracture of earlier bars. In fact, if the quote manages to fix at least below 1.1115, this theory will sparkle with new colors and most traders will believe in a downward move.
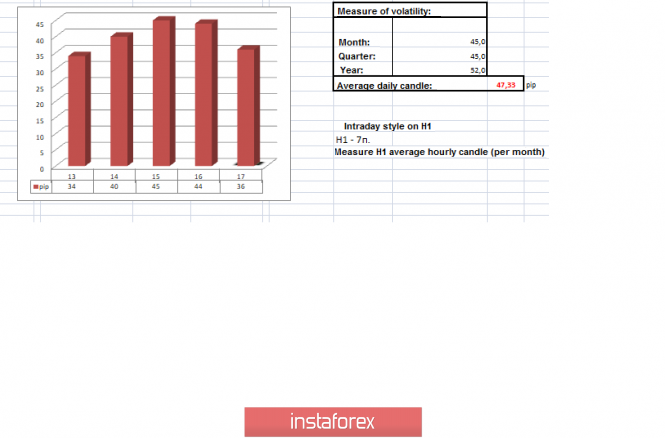
In terms of volatility, we have extremely stable indicators that are close to the average daily value. Such statistics confirm a rather good emotional background of the market, where both speculators and intraday traders get along, which cannot be said about conservative market participants.
Analyzing the past days by the minute, we can see a series of pulsing downward candles that have switched to a local inertial course [13:30-16:30 London time in the trading terminal]. The subsequent oscillation was in terms of a rollback/stagnation with a small amplitude.
As discussed in the previous review, speculators had local long positions from 1.1150, and at the same time, not forgetting about the restrictive order.
Looking at the trading chart in general terms [the daily period], we see a lot of discussions about the trend change. The oblong correction, which has been taking place for as long as 3.5 months, made its own adjustments to the existing market cycles, but did not change the direction of the trend itself. Open the daily chart and analyze it from at least 2018.
The news background of the previous day included data on the United States, which turned out to be much better than forecasts. The indicators for the applications for unemployment benefits decreased by 46 thousand [Repeated - 36 thousand, the forecast - 11 thousand; Primary - 10 thousand, the forecast - +5 thousand]. At the same time, there were very good indicators for retail sales, which, according to forecasts, should have slowed from 3.3% to 2.9%. Iinstead , there was an acceleration to 5.8%.
The market's reaction to the statistical data was almost instantaneous in terms of strengthening the dollar. The inertial move was set.
In terms of informational background, a broad discussion of the previously signed first phase of the trade agreement between US and China continues. This time, the noise came to US from Europe, where the European commissioner for trade, Phil Hogan, said that EU can file a claim with the WTO regarding the previously concluded deal, as it violates the rules of free trade.
"We have not studied the document in detail, and if there is a question of compliance with the WTO rules, we will, of course, file a complaint. We are not happy about this and would not like to create such an impression, but we will defend our own economic interests in the context of the US agreements with Japan and China. We will study everything carefully," the European Commissioner said.
Today, in terms of the economic calendar, we had data on inflation in Europe. As predicted, there was an acceleration from 1.0% to 1.3%, however, there was almost no market reaction, even though the indicator is not bad for the Eurozone.
We are still waiting for statistics from the United States, where the rate of industrial production continues to decline from -0.8% to -1.2%, and the construction of new buildings may decrease by 2.6%, and construction permits by 1.6%.

The upcoming trade week, in terms of the economic calendar, begins with a weekend in the United States, where Martin Luther King Day is celebrated. The following days do not have a wide flow of statistical data, but we have a meeting of the ECB, followed by a press conference where the rate will not be touched. There may, however, be juicy details about the further actions of the regulator, which many expect.
The most interesting events are displayed below - - - >
Wednesday, January 22:
USA 16:00 London time - sales in the secondary housing market (m/m) (Dec): PREV. -1.7% - - - > Forecast 0.8%
Thursday, January 23
ECB meeting, followed by a press conference
Further development
Analyzing the current trading schedule, we can see a rapid downward move, although inertial, which has already managed to return the quote to the area of the base of the corrective movement. This is a good sign in terms of resuming the downward movement. If we analyze the market in detail, we will see that at the same time, GBP/USD, against the background of not the best statistics for Britain, sharply began to lose its positions in the form of a correlation. It is worth considering that yesterday's data on the United States did not fully play out in the market, and the current situation perfectly confirms this.
In terms of the emotional component of the market, we can see a sharp surge in speculative positions, which is confirmed by the structure of trading candles.
Detailing the available trading day by the minute, we can see that before the start of the European session, there was an accumulation process in 1.1130/1.1140. However, at 8:30 London time [time on the trading terminal], there was a surge of activity, quickly overcoming the limits of accumulation.
Yesterday's speculators changed their long positions to short ones, as soon as they saw such remarkable inertial candles. The subsequent flood of trading volumes occurred at the time of the breakdown of the morning accumulation, just flying into the current inertia. Partial exits from short positions are already being made.
The movement is likely directed towards the range level of 1.1080, however, it faces a minimum of January 14 [1.1104], which can locally put pressure on short positions, and lead to wider fixing of trading operations. In any case, at the moment, the benchmark for most traders is in the face of the range level, as many are eager to break it. I am not sure though if the price will be able to break it now.

Based on the above information, we have derived these trading recommendations:
- Buy positions will be considered near the range level of 1.1080. In the case of a local rebound, you can also look at the minimum of January 14, again in the form of local operations.
- Positions for sale are already available and are being fixed. If we do not have any deals, we can consider a local entry lower than 1.1100 with a prospect to 1.1085 [Risky trade]. The main positions will be considered after the price fixes below 1.1080.
Indicator analysis
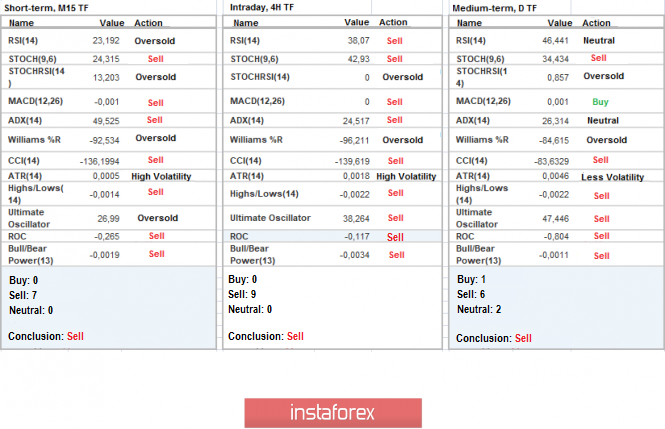
Analyzing different sectors of timeframes (TF), we see that against the background of such a strong inertia, all technical instruments, without exception, turned in the downward direction, signaling sales.

Volatility for the week / Measurement of volatility: Month; Quarter; Year
The measurement of volatility reflects the average daily fluctuation, based on the calculation for Month / Quarter / Year.
(January 17 was based on the time of publication of the article)
At the moment, volatility is at 36 points, which is even lower than normal. It is likely that there is still a chance of increasing volatility, just in the phase of the inertial course.

Key level:
Resistance zones: 1.1180; 1.1300**; 1.1450; 1.1550; 1.1650*; 1.1720**; 1.1850**; 1.2100
Support areas: 1.1080**; 1.1000***; 1.0900/1.0950**;1.0850**; 1.0500***; 1.0350**; 1.0000***.
* Periodic level
** Range level
***Psychological level
***** This article is based on the principle of conducting a transaction, with daily adjustments


