EUR/USD
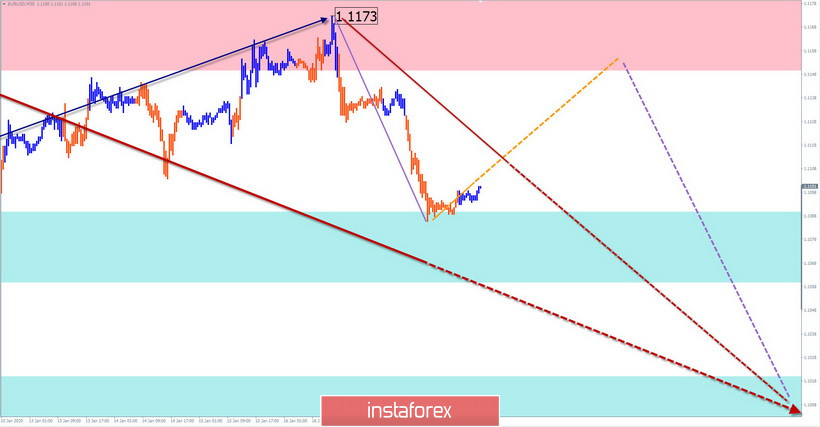
On the hourly scale of the euro chart, the incomplete wave counts down from the beginning of September and is directed upwards. The chart shows the formation of a downward correction. The price forms the final part (C) of this construction. The structure is not complete.
Forecast:
The decline that began at the end of last week has high chances to continue further. In the first half of the day, sideways are possible. Short-term price rise to the resistance zone is not excluded. A new stage of decline can begin today.
Potential reversal zones
Resistance:
- 1.1150/1.1180
Support:
- 1.1090/1.1060
- 1.1020/1.0990
Recommendations:
Purchases of the euro today are risky and can be unprofitable. At the end of upward pullbacks, it is recommended to track the pair's sell signals. It is necessary to take into account the short-term nature of the entire downward wave.

AUD/USD
Analysis:
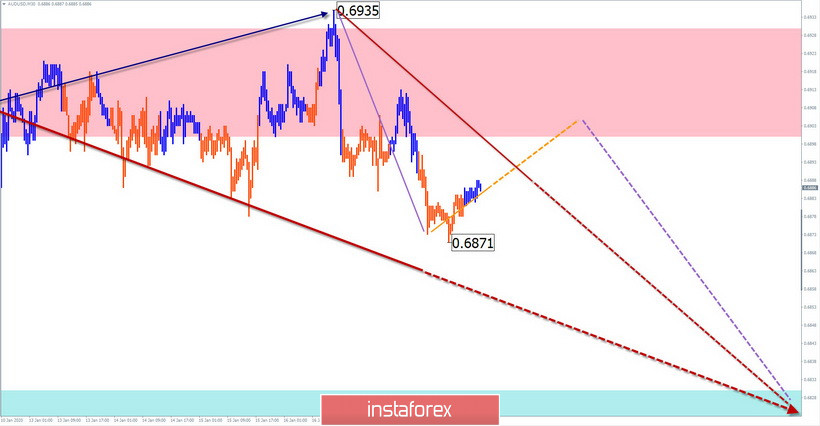
On the "Australian" chart, the downward wave continues to form. It has the appearance of an upward pennant. An intermediate correction is formed in the structure of the final part of the wave.
Forecast:
Today, the pair's price movement is expected to continue in the corridor between the opposite zones with a general downward vector. In the upcoming session, a short-term rise in the rate to the upper limit of the price channel is possible.
Potential reversal zones
Resistance:
- 0.6900/0.6930
Support:
- 0.6830/0.6800
Recommendations:
The pair's purchases are not promising today. It is recommended that you focus on searching for sales signals for the instrument.

USD/CHF
Analysis:
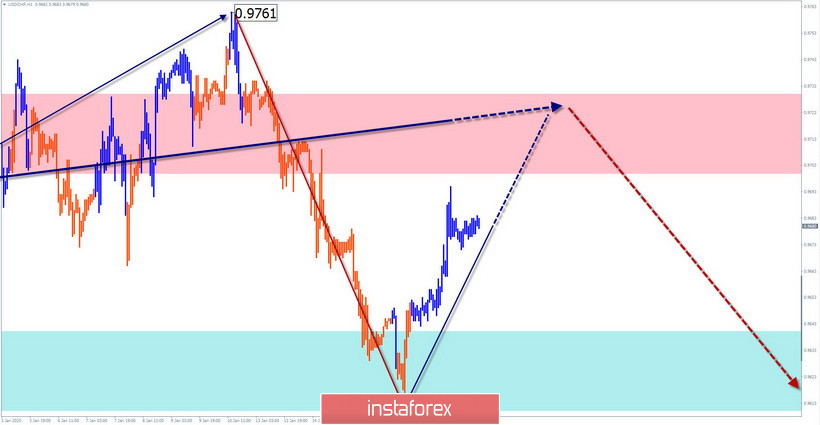
On the franc chart, the direction of short-term trends is set by the bearish wave algorithm from April 23 last year. The structure shows a zigzag (A-B-C). The final part is not completed. The price has reached strong support. From the beginning of the year, an intermediate correction is formed.
Forecast:
In the next trading sessions, there is a high probability that the price rise will end. Then you can count on the formation of a reversal. By the end of the day, the price is expected to start moving down.
Potential reversal zones
Resistance:
- 0.9700/0. 9730
Support:
- 0.9640/0. 9610
Recommendations:
Until the end of the upward correction, purchases of the franc are only possible in the form of short-term small lot transactions. After the appearance of clear signals of an imminent change of rate, it is recommended to get into short positions on this instrument.

GBP/JPY
Analysis:
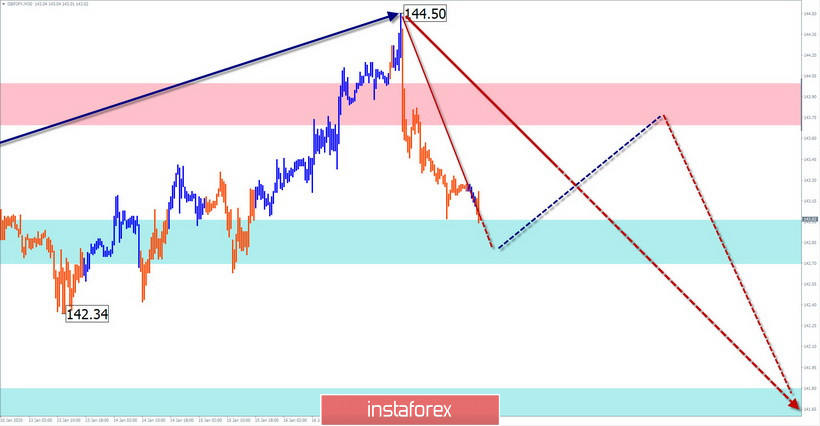
Analysis of the cross wave pattern shows the incompleteness of the bearish wave from December 13. In the last 2 weeks, a flat correction was formed. The decline that started on Friday has a high wave level and can be the beginning of the final part (C) of the main wave.
Forecast:
If the reversal is confirmed, the pair's price will actively decline in the coming days. In the first half of the day today, a "sideways" between the nearest oncoming zones is possible. By the end of the day, the pair's volatility may increase.
Potential reversal zones
Resistance:
- 143.70/144.00
Support:
- 143.00/142.70
- 141.80/141.50
Recommendations:
It is recommended to refrain from buying the pair and focus on finding the most successful places to sell the instrument.

Explanations: In the simplified wave analysis (UVA), waves consist of 3 parts (A-B-C). The last incomplete wave is analyzed. The solid background of the arrows shows the formed structure and the dotted background shows the expected movements.
Note: The wave algorithm does not take into account the duration of the tool's movements in time!


