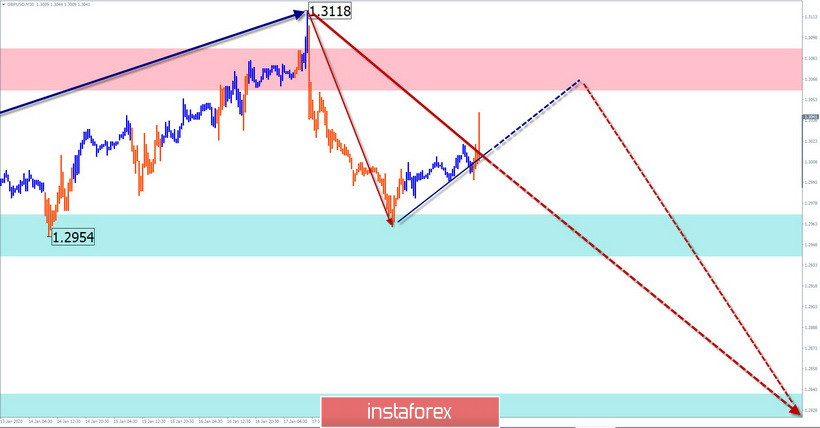
GBP/USD
Analysis:
Despite the dominant bullish trend on the pound chart, the short-term direction points to the "south" of the chart. In the wave structure since December 23, the price forms a correction in the form of a horizontal triangle. The design is nearing its logical conclusion.
Forecast:
Today, the flat mood of the previous days' movement is expected to continue. In the first half of the day, an upward vector is possible. You can expect a change of direction by the end of the day or tomorrow.
Potential reversal zones
Resistance:
- 1.3060/1.3090
Support:
- 1.2970/1.2940
- 1.2840/1.2810
Recommendations:
Purchases of the pound are now possible in intra-session trading. It is safer to wait for the completion of the upward trend and track the entry signals to short positions.

USD/JPY
Analysis:
The direction of the yen's movement on a short-term scale coincides with the course of the dominant trend since August last year. After a 2-month sideways correction, the pair's price started up on January 8. After breaking through a strong resistance since the beginning of last week, the price rolls back down.
Forecast:
In the coming trading sessions, the entire rollback is expected to be completed, a reversal is expected to be formed, and the pair's rate will begin to rise. The nearest lifting target is shown by the calculated resistance.
Potential reversal zones
Resistance:
- 110.60/110.90
Support:
- 109.80/109.50
Recommendations:
Due to the expected small move of the pair downwards, the pair's sales are unpromising today. It is recommended to track reversal signals to find entry points for long positions.

Explanations: In the simplified wave analysis (UVA), waves consist of 3 parts (A-B-C). The last incomplete wave is analyzed. The solid background of the arrows shows the formed structure and the dotted background shows the expected movements.
Note: The wave algorithm does not take into account the duration of the tool's movements in time!


