


Last week, the pair strayed from the support line of 1.2961 (the white bold line), moved up and tested the pullback level of 50.0% - 1.3166 (the blue dotted line). Most likely, this week, the price will try to move up again to break through the resistance line - 1.3210 (black bold line).
Trend analysis.
This week, the price moved up after reaching the resistance line of 1.3210 (black bold line) and it may go down to break through the support line of 1.3016 (white bold line).
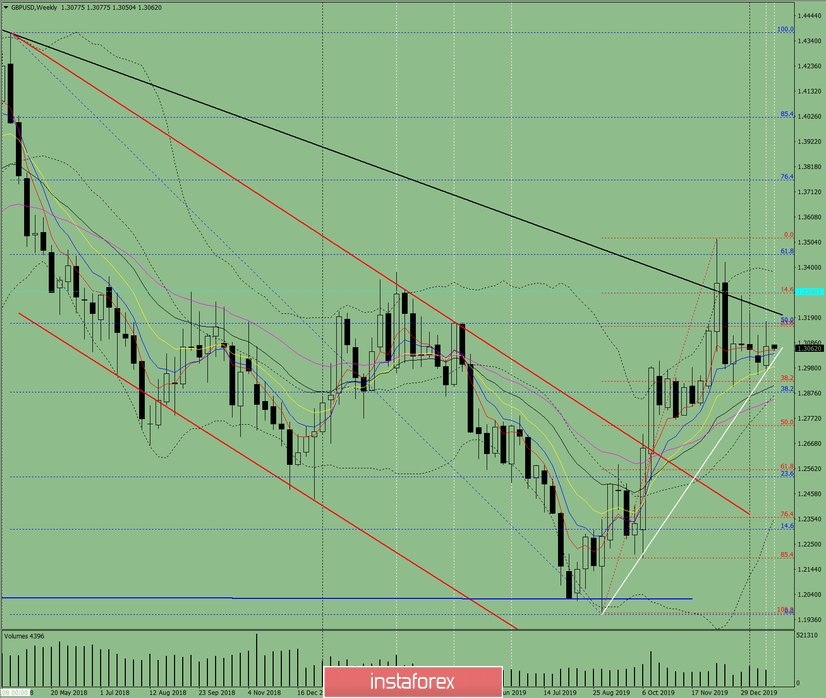
Fig. 1 (weekly chart).
Complex analysis:
- Indicator analysis - down;
- Fibonacci levels - up;
- Volumes - down;
- Candle analysis - neutral;
- Trend analysis - up;
- Bollinger Bands - up;
- Monthly chart - up.
The conclusion of the complex analysis - an upward movement to the level of 1.3210, then the bottom.
The overall result of calculating the candle of the GBP / USD currency pair according to the weekly chart: the price of the week is likely to have an upward trend with the absence of the first lower shadow of the weekly white candlestick (Monday - up) and the presence of the second upper shadow (Friday - down).
Upon reaching the resistance line of 1.3210:
- the upper scenario is breaking through and going up with the target of 1.3283 - upper fractal;
- the lower scenario - work down with the first target of 1.2904 - lower fractal.


