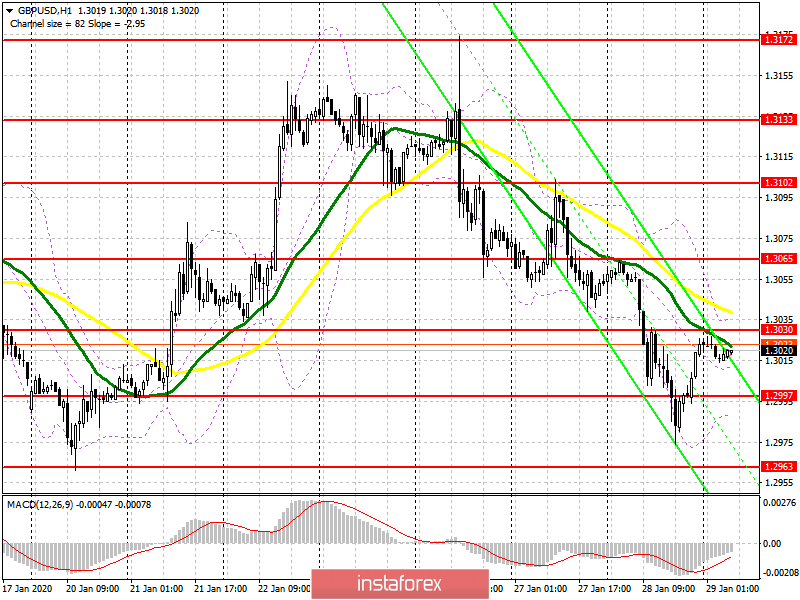
To open long positions on GBP/USD you need:
Buyers released the pound yesterday, which led to an update of quite important support levels, but the bulls rehabilitated very quickly in the afternoon, creating the first prerequisites for the formation of a new lower boundary of the rising channel. The primary task for them today will be to maintain the support range of 1.2997-90, where the formation of a false breakout will be the first signal to open long positions. It is also possible to build the lower boundary of the rising channel in this area. An important point will be a break and consolidation above the resistance of 1.3030, which will lead to the demolition of stop orders of sellers and a larger upward correction to the area of highs 1.3065 and 1.3102, where I recommend taking profits. If the bulls do not have enough strength to cope with the pressure of sellers in the area of 1.2997, then in this scenario, it is best to postpone purchases until the lows of 1.2963 and 1.2939 are updated, which will mean a bearish trend.
To open short positions on GBP/USD you need:
The bears clearly did not expect such a rebuff and now their task in the first half of the day will be to protect resistance at 1.3030, a little above which the moving average also goes. The formation of a false breakout in this range will be a signal to sell GBP/USD, which will return the pound to the support area of 1.2997-90, near which the main struggle for the further direction will unfold. Consolidation below this area will quickly push the pair to the lows of 1.2963 and 1.2939, where I recommend taking profits. If pressure from sellers in the resistance area of 1.3030 will not be formed, then in this case, short positions are best postponed to the test of highs 1.3065 and 1.3102.
Signals of indicators:
Moving averages
Trade is conducted around 30 and 50 moving average, which indicates a possible change of direction in the near future.
Bollinger bands
A break of the upper boundary of the indicator at 1.3035 will lead to a surge in pound purchases. In case the pair declines, the lower border in the 1.2985 area will provide support.

Description of indicators
- Moving average (moving average determines the current trend by smoothing out volatility and noise). Period 50. The graph is marked in yellow.
- Moving average (moving average determines the current trend by smoothing out volatility and noise). Period 30. The graph is marked in green.
- MACD indicator (Moving Average Convergence / Divergence - moving average convergence / divergence) Fast EMA period 12. Slow EMA period 26. SMA period 9
- Bollinger Bands (Bollinger Bands). Period 20


