


Trend analysis (Fig. 1).
Today, an upward movement is possible with the target of 1.3161, the support line in a black bold line. After that, a retreating downward movement is expected with the initial target of 1.3119, the retracement level of 23.6% presented in a blue dashed line.
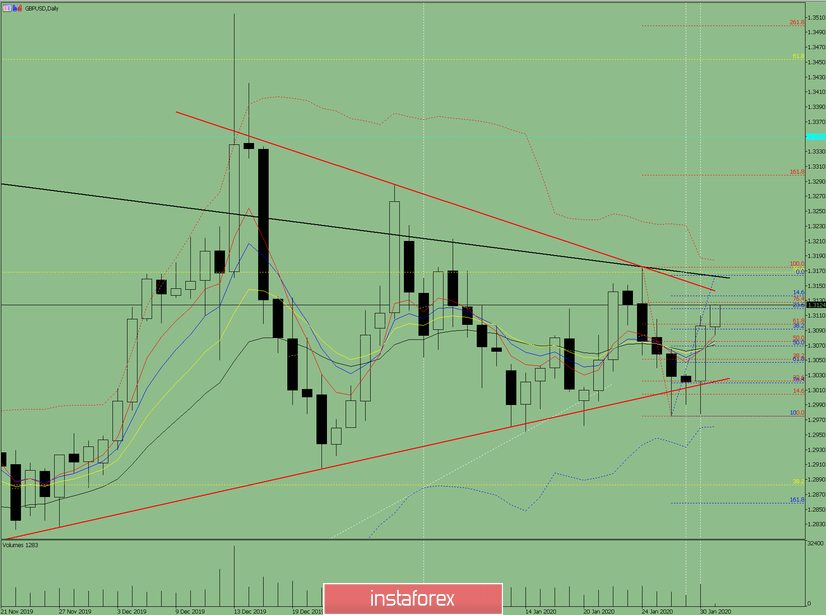
Fig. 1 (daily chart).
Comprehensive analysis:
- Indicator analysis - up;
- Fibonacci levels - up;
- Volumes - up;
- Candlestick analysis - up;
- Trend analysis - up;
- Bollinger Lines - up;
- Weekly schedule - up.
General conclusion:
The price may continue to move up today.
A downward scenario is unlikely but quite possible. That is, from the resistance line 1.3142, presented in a red bold line, work down with the target and the lower fractal at 1.2975.


