


The EUR/USD pair ended the trading week at the borders of the 11th figure. The sharp jump in the price was primarily due to the general weakening of the dollar – European statistics were mostly disappointing, so the euro did not have a clear argument for its growth. However, the dollar did not have sufficient reasons for such a large-scale devaluation. According to the general opinion of experts, the completion of the week and month played a key role in the formation of the price's upward movement.
In the economic calendar, the first week of February is uneventful. The "headliner" of the week will be Friday's Nonfarms, which will either confirm or refute the negative dynamics in the US labor market. Other indicators (except for the ISM production index) are secondary. However, under certain circumstances, they can also play a role for the EUR/USD pair.
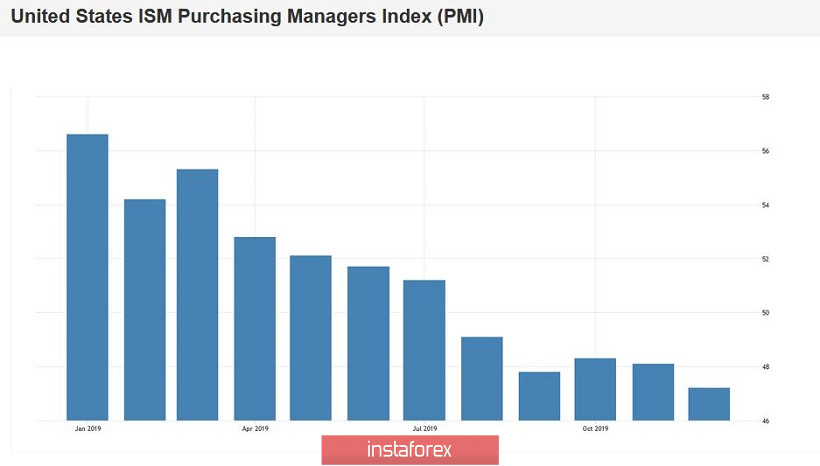
On Monday, all the attention of EUR/USD's traders will be focused on the US ISM manufacturing index, which can significantly damage the positions of dollar bulls. Recall that the recent US production indicators were unsatisfactory, and this fact puts background pressure on the US currency. In early January, this pressure increased significantly – the December US manufacturing ISM unexpectedly collapsed to 10-year lows, reaching 47.2 points. The index has been below the key 50-point mark since August, and a consistent downward trend has been observed since April last year. According to forecasts, the indicator was expected to grow slightly from 48.1 to 49 points, however, it fell to multi-year lows, which is the weakest result since June 2009. This significant decline in the overall index was primarily due to a reduction in production – the corresponding index fell to 43.2 points, after rising to 49.1 in November. Although the price component of the ISM index increased significantly (up to 51 points), this fact did not affect the overall market reaction.
Note that according to general forecasts, the January ISM indicator may show a small increase – up to 48.5 points. Although the indicator will still remain below the key 50-point mark, positive dynamics will support the dollar. In this case, the index showing growth will be important.
On Wednesday, February 5, the ISM composite index for the non-manufacturing sector will be published. It may also have an impact on EUR/USD, but not as significant as the manufacturing index. The pair can react violently to the release only if the result significantly deviates from the forecast value – in one direction or another. According to general expectations, the indicator will be released almost at the same level as in December – at the level of 55 points.
On Thursday, we will find out the minutes of the last ECB meeting. This document is unlikely to please the European currency, as at the January meeting, Christine Lagarde took a rather cautious position, and her rhetoric was "dovish". She gave a restrained assessment of inflation growth in the Eurozone, and as if to confirm her words, core inflation slowed to 1.1% in January. Most likely, the minutes of the meeting will be soft, putting additional pressure on the euro.
The major event of the week will be the Nonfarm. Recall that the previous release, which was published in early January, made a mixed impression. Almost all components came out worse than expected, reflecting unhealthy trends in the labor market. Only the unemployment rate remained at the previous values, at around 3.5%. However, the unemployment rate does not react so quickly to the current situation – this indicator is one of the lagging economic indicators. Therefore, some traders' optimism about low unemployment is premature, since more operational indicators are not so optimistic – all components came out below the forecast values.
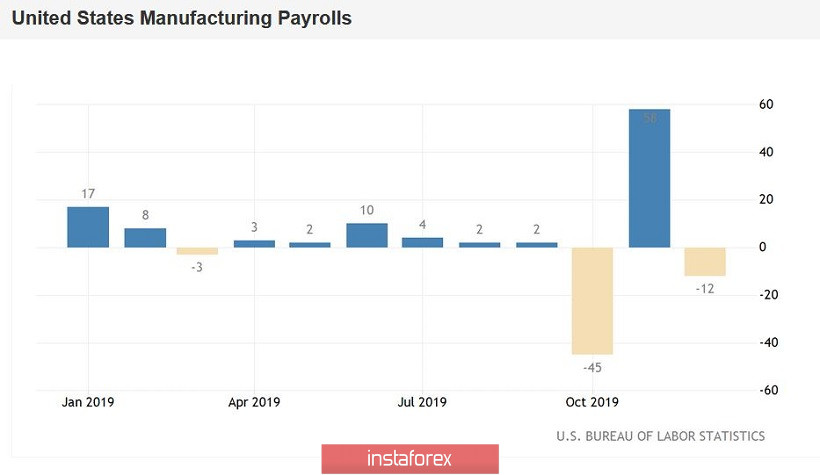
Instead of an increase of 165 thousand (consensus forecast), the employment growth rate increased by 145 thousand. However, the number of jobs in the manufacturing industry has decreased (by 12 thousand). In just a short time, the indicator dives into negative territory for the second time – in October, it fell immediately by 49 thousand. The inflation component of Nonfarm Payrolls – the level of average hourly wages - was particularly disappointing. This Fed's most important indicator was at 0.1% on a monthly basis (the worst result since September last year, when it fell to zero), and at 2.9% on an annual basis (the worst result since July 2018).
According to the general forecast, the January Nonfarm will produce a significant result. The employment growth rate should rise to 160 thousand, and the average hourly wage should return to a three percent mark. At the same time, the growth rate of those employed in the manufacturing sector of the economy may again show a negative result, although not as significant as that of December (the indicator should be reduced by 4 thousand).
Needless to say, if the Nonfarm disappoint this time, the dollar will again be under pressure. The Fed will no longer be able to "turn a blind eye" to these trends (as it did at the January meeting) – especially if the inflation component of NonFarm goes down..
At the same time, the coronavirus factor will also affect the dynamics of dollar pairs in general, and the dynamics of EUR/USD in particular. Alarm signals about the spread of the virus and the growing number of its victims will continue to be closely monitored by market participants. The beneficiaries of this situation will be the protective instruments, but whether the dollar will join them is an open question. Friday's dynamics of the EUR/USD pair suggests that the US currency may suddenly weaken throughout the market, despite the continuing anti-risk sentiment. Please note that protective instruments (the yen and gold in particular) were actively strengthening on Friday, reflecting the panic mood of traders. However, the dollar "failed" in this context, suggesting that the US currency may turn from being a "defender" to a "victim", if the general fear about the epidemic's negative impact on the US economy continues to strengthen.
From a technical point of view, the pair's bulls need to overcome the 1.1120 mark – in this case, the Ichimoku indicator on the daily chart can form a bullish "Parade of Lines" signal, opening the way for buyers to the borders of the 12th figure. For bears, the task is not so complicated – they need to return the price to the 1.0980 mark (the lower line of the Bollinger Bands on the same timeframe), and then consolidate below to confirm the strength of bearish sentiment.


