To open long positions on EURUSD, you need:
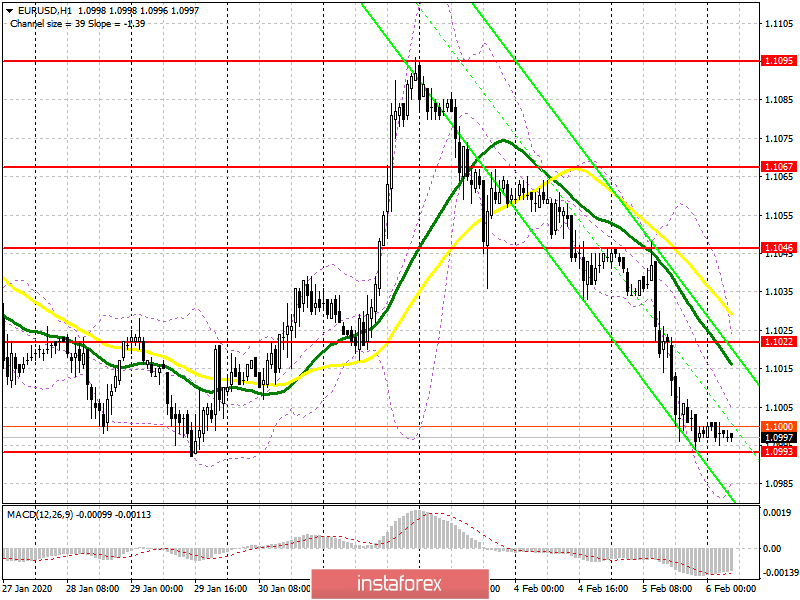
Good data on the US non-manufacturing sector and the number of employees from ADP maintained demand for the US dollar in the afternoon on Wednesday. This has caused even more problems for buyers since there is no special activity in the support area of 1.0993, which may lead to a further fall in EUR/USD. However, the last hope of the bulls remains the lower border of the Bollinger indicator in the area of 1.0984, as well as the divergence on the MACD indicator, which may form after the update of yesterday's minimum. All this should lead to a false breakdown of the support of 1.0993, which will be a signal to open long positions in the euro to return to the resistance of 1.1022. An equally important task for the bulls will be to break through and consolidate above this range, which will open a direct road to the area of the maximum of 1.1046, where I recommend fixing the profits. In the scenario of a support breakout of 1.0993, it is best to catch euro purchases only after updating the lows of 1.0964 and 1.0943.
To open short positions on EURUSD, you need:
Bears continue to play out their scenario and have already tested a fairly powerful level of 1.0993, a break and consolidation below which will quickly push the euro down to the lows of 1.0964 and 1.0943, where I recommend fixing the profits. Today's speech by European Central Bank President Christine Lagarde and the European Commission report may put additional pressure on the pair. In the scenario of an upward correction of EUR/USD in the first half of the day, you can expect to sell after the resistance update of 1.1022, provided that a false breakdown is formed there, or open short positions immediately for a rebound from the more powerful area of 1.1046.
Signals of indicators:
Moving averages
Trading is conducted below the 30 and 50 moving averages, which indicates the predominance of sellers in the market.
Bollinger Bands
Support will be provided by the lower border of the indicator in the area of 1.1084, while growth will be limited to the upper level of the indicator in the area of 1.1022.

Description of indicators
- Moving average (moving average determines the current trend by smoothing out volatility and noise). Period 50. The graph is marked in yellow.
- Moving average (moving average determines the current trend by smoothing out volatility and noise). Period 30. The graph is marked in green.
- MACD indicator (Moving Average Convergence / Divergence - Moving Average Convergence / Divergence) Fast EMA Period 12. Slow EMA Period 26. SMA Period 9
- Bollinger Bands (Bollinger Bands). Period 20


