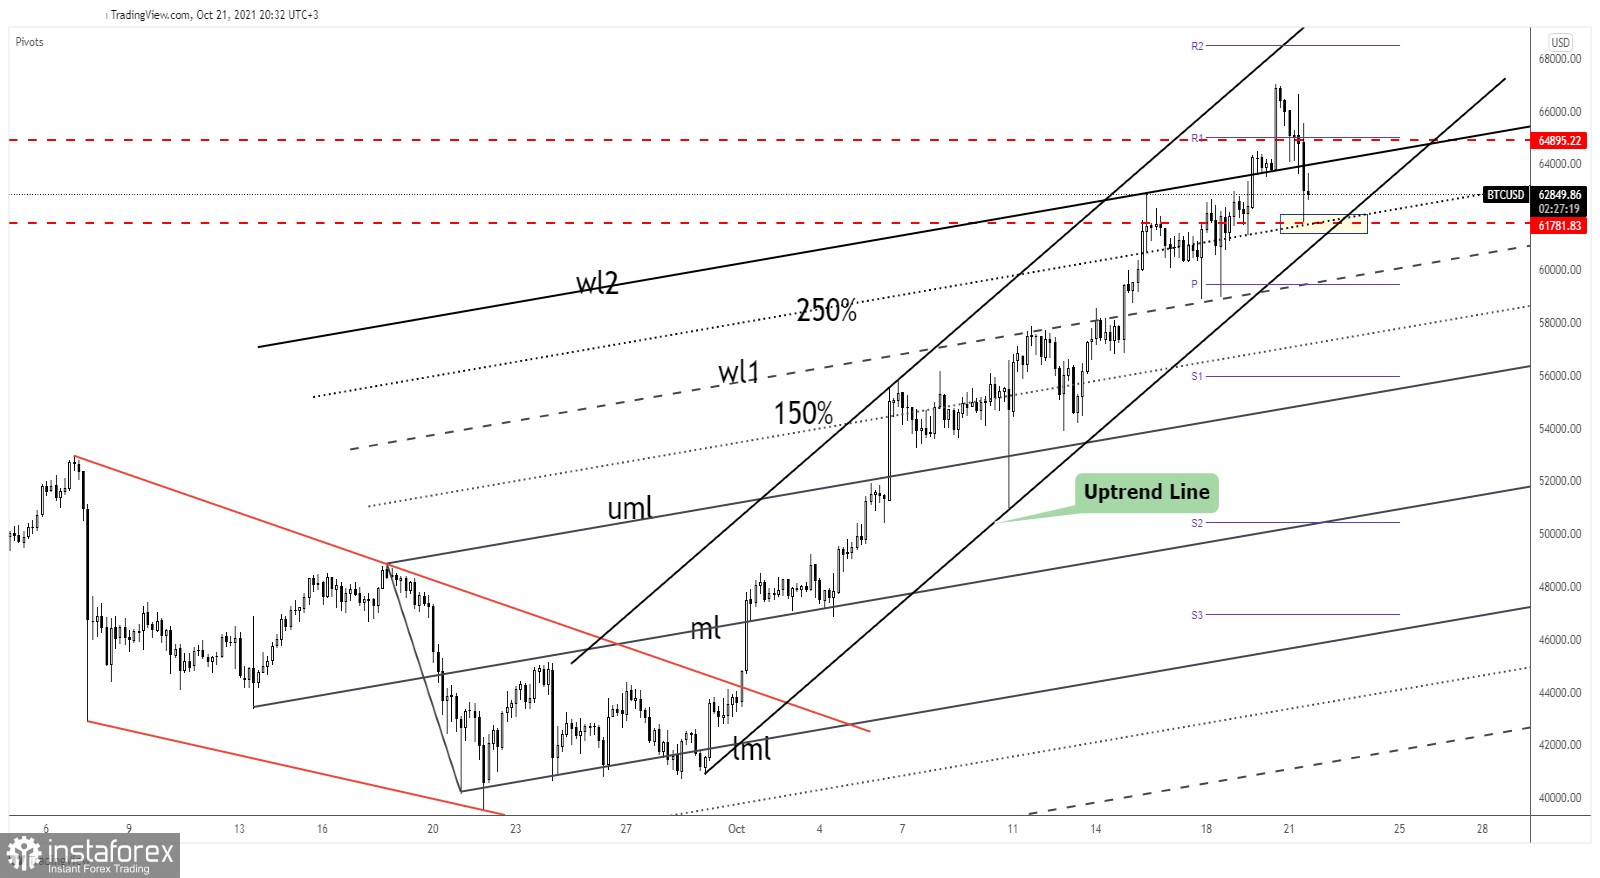
Bitcoin plunged after reaching a fresh all-time high of 67,016.50. It has dropped as low as 61,850 in today's session where it has found support. BTC/USD registered a 7.71% fall from the fresh historical high to the current daily low.
Technically, the price of Bitcoin reached strong support levels, former resistance levels. A bullish pattern printed could bring a new leg higher. Still, BTC/USD has shown overbought signs, but it's premature to talk about a larger downside movement.
BTC/USD at support

BTC/USD failed to stabilize above 64,895.22 former all-time high and now it stands under the second warning line (wl2) of the Ascending Pitchfork. It has found temporary support right above 61,781.83 key level.
As you can see, the price of Bitcoin is trapped within an up channel. The bias remains bullish as long as the rate stands within this pattern. From the technical point of view, we have a strong confluence area at the intersection between the 250% line with 61,781.83 and with the uptrend line.
Making a false breakdown through this area or printing a major bullish engulfing pattern may bring new bullish momentum.
Bitcoin outlook
The outlook is bullish, as the current retreat could help us to catch new upside movements. A bullish pattern on the immediate support levels may bring new long opportunities. Bitcoin is still expected to increase despite the price failing to reach and retest the channel's upside line signaling potential exhaustion.
Technically, only a valid break below the uptrend line could invalidate the upside scenario. BTC/USD could start increasing again as long as it stays above the 61,781 level.


