


Hello, dear traders!
As mentioned in the latest review of the pound/dollar pair, Tuesday was the most important and only day for the British currency in terms of the release of macroeconomic statistics.
In short, all the data from the UK that was published yesterday came out better than expected. Except for reports on industrial production, which are both annual and monthly were weaker than the forecast values.
But market participants were pleased with the data on GDP, the total balance of trade and commercial investment in annual terms. All specific figures can be seen in the economic calendar, so I will not give them here.
In principle, yesterday's releases from the UK can not be called failed (or even bad). Rather, they were moderately positive, which supported the British pound, which showed a strengthening against the US dollar at the end of yesterday's trading.
Daily
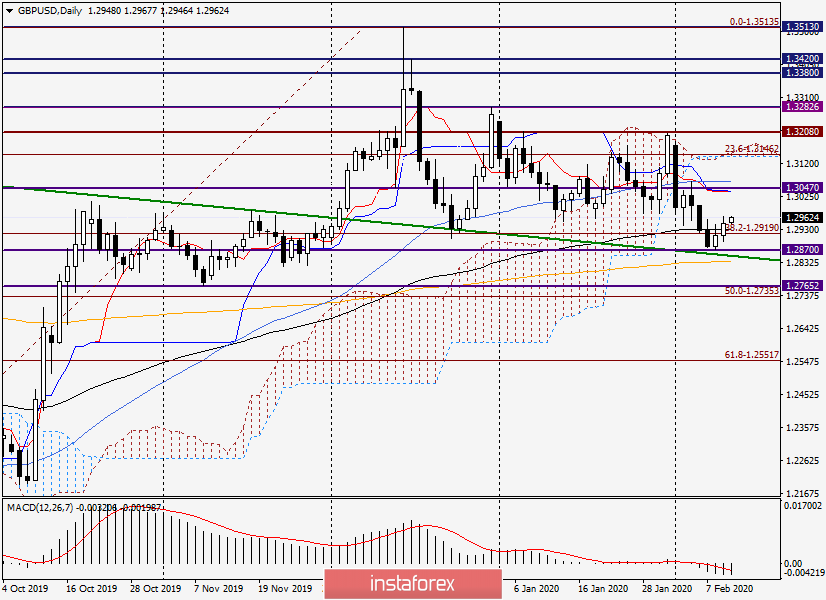
During yesterday's trading, the pound/dollar pair found support at 1.2893 and began to strengthen due to good statistics. Yesterday's session ended at 1.2948, while the closing price was higher than the strong 89 exponential moving average, which did not allow the quote to go up for the previous two days. Of course, for one candle closed above 89 EMA, it is too early to make a clear conclusion about the true breakdown of this exponent, however, "the first bell has already rung out." If today's trading closes above 89 EMA, we can assume with more confidence that this moving average is broken.
In general, looking at the daily chart, my impression is that the pound is going to make a deeper correction. I believe that under certain circumstances, it is quite possible to expect growth in the area of 1.3040-1.3070. As can be seen on the chart, there is a significant technical level of 1.3047, as well as the Tenkan and Kijun lines of the Ichimoku indicator converged, and 50 simple moving average lies near 1.3070. All of the above is a very serious test for the pound bulls. I assume that it is in the selected price zone that the further direction of the British currency will be decided. Yes, there are still many factors that can affect the price movement of GBP/USD, but now we are considering only the technical picture.
A bearish scenario on the daily will signal a breakdown of the support of 1.2870, going under the broken green resistance line and passing down the 200 EMA. In this case, the pound/dollar will go to the support of 1.2765 and will test it for a breakdown. However, both the zone of 1.3040-1.3070 and the support of 1.2765 are quite far from the current price, so let's move to lower timeframes and see what is the situation there and whether we can find any real options for entering the market.
H4
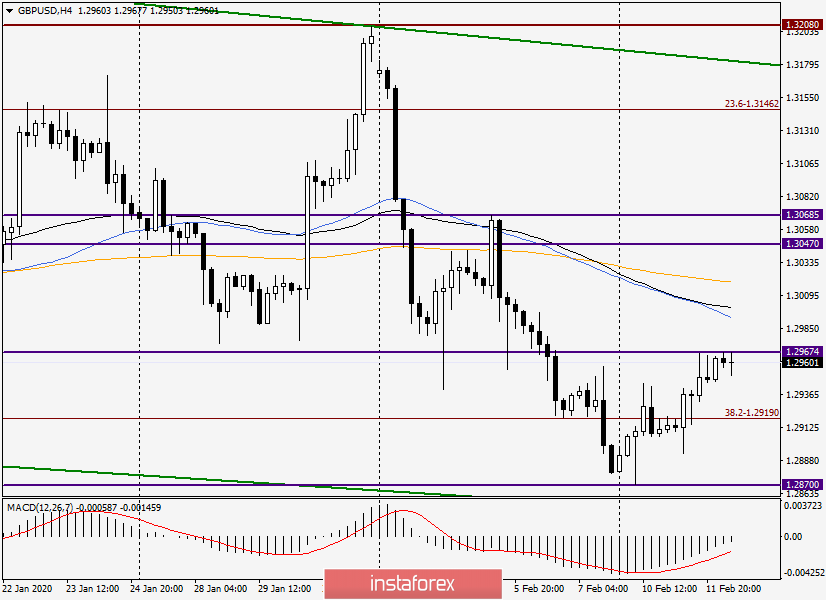
Here, so far, everything looks very groundless to claim the growth of the pound. First, the pair hit the level of 1.2967, which provides quite strong resistance and does not allow the quote to go higher. Secondly, the 50 MA, 89 EMA and slightly above 200 EMA have accumulated near the psychological and technical mark of 1.3000. I believe that only the breakdown of the 200 EMA with the mandatory fixing above will indicate the further readiness and ability of the "Briton" to move up. For now, there are more questions than answers on this timeframe.
H1
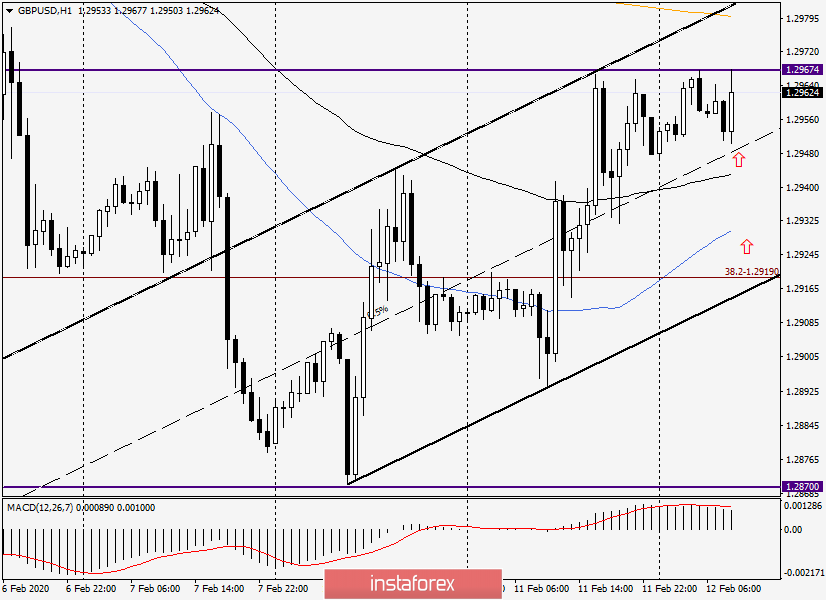
And here is a "young" rising channel that has yet to prove its worth. In the meantime, we see that the pair has fixed above the average line (dotted), which is an important point and is trying to continue yesterday's growth. It will be very interesting to see how the price behaves near the upper border of the channel, where there is also 200 EMA. Technically, this is a pretty good option for selling GBP/USD.
If we talk about purchases, they have technical grounds near 1.2950, 1.2930 and 1.2920.
However, at the end of the review, the pair is showing growth and shows intentions to break through the resistance of sellers at 1.2967. In such cases, I suggest buying or selling on a rollback to a broken line or level. But not this time. At the top is the channel resistance line and 200 EMA!
To open positions in a pair, I suggest taking into account all the price benchmarks given in this article (there are not so many of them), and looking for additional signals for opening positions in the form of characteristic patterns of Japanese candlesticks.
Good luck!


