


The pair continued to move upward on Wednesday, testing the resistance line 1.2991 (red bold line). Today, strong calendar news for the dollar is expected at 13:30 UTC. A retracement of the downward movement is possible with the first target at 1.2921, the resistance level (white bold line).
Trend analysis (Fig. 1).
Today, from the level of 1.2960 (yesterday's closing candle), a downward movement is possible with the first target of 1.2921, the resistance level (white bold line). If this level is reached, there is a roll back up with the target of 1.3000, the resistance line (red bold line).
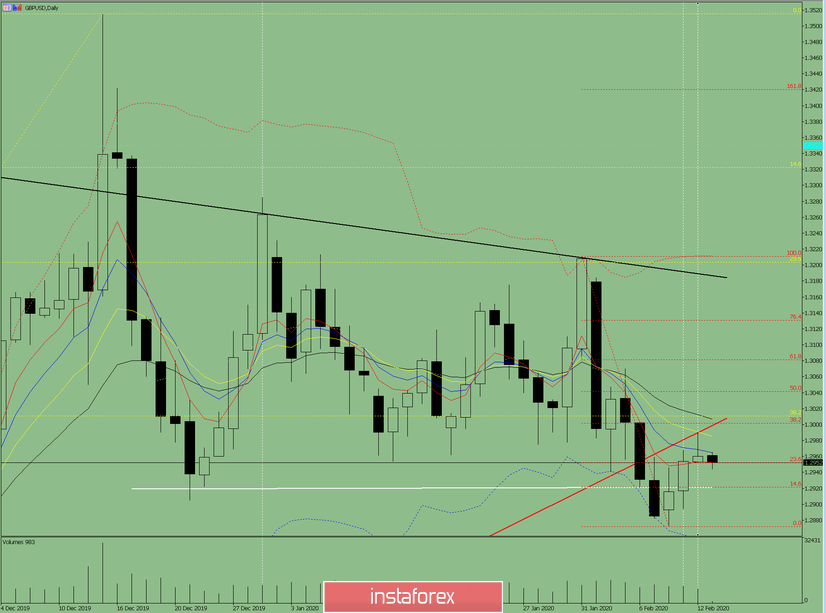
Fig. 1 (daily chart).
Comprehensive analysis:
- Indicator analysis - down;
- Fibonacci levels - down;
- Volumes - down;
- Candlestick analysis - down;
- Trend analysis - down;
- Bollinger lines - down;
- Weekly schedule - up.
General conclusion:
Today, the price can roll back on a downward movement.
An unlikely, but quite possible scenario is from the support line 1.2921 (white bold line), work down with the target 1.2872, the lower fractal (red dashed line).


