


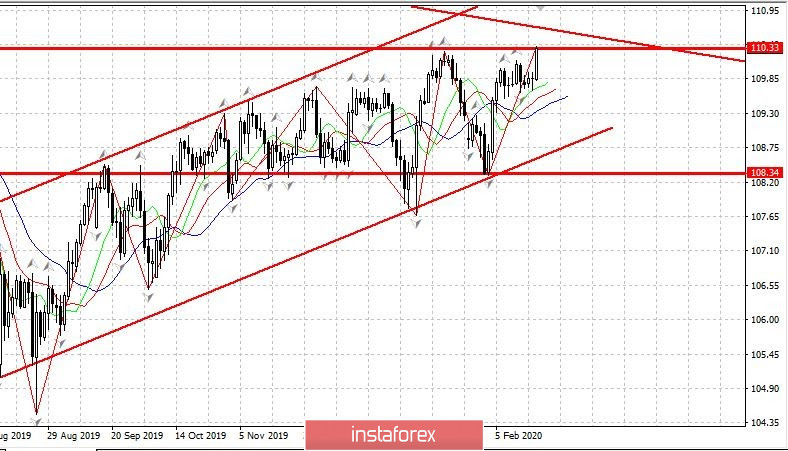
Above is the daily USDJPY chart - we see that the yen, after a long consolidation, breaks up to the important level of 110.30 - this is the level of the weekly order. If the day closes above this point, this is a strong signal for the yen trend in favor of the dollar. Thus, the yen (in case of a successful breakthrough) will become the second asset that enters the trend of strengthening the dollar, after the euro.
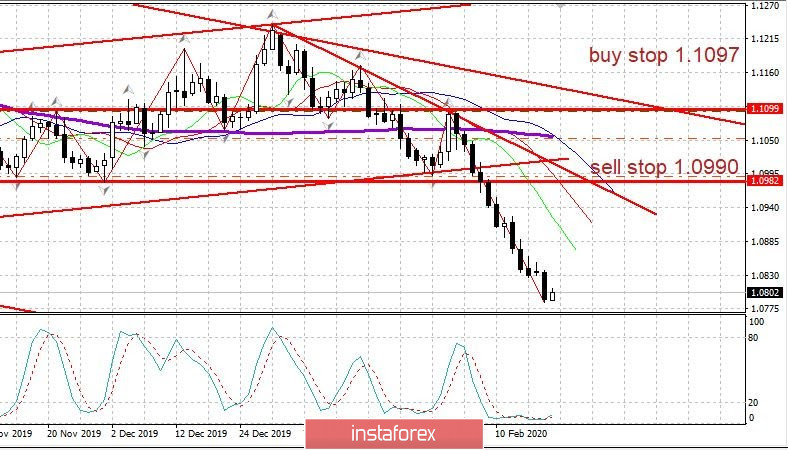
This is EURUSD - the daily chart.
The downward trend in the euro is clearly visible.
Note that when a trend is clearly visible on the daily chart - a reversal requires a figure that is clearly visible at least on the H4 chart; and if the trend is clearly visible on the weekly chart, the reversal pattern should be visible on the daily chart.
The chart clearly shows the goals for the daily pullback - note that there has not been a daily scale pullback since the beginning of the trend.
The first pullback - to the green line - that is, to 1.0905.
The second pullback - to red - that is, to 1.0940.
The third pullback - to the blue - 1.0980 - and closing the day above the blue - cancel the trend.
We keep sales from 1.0990 - we sell from the rebounds to the top - the possible levels of pullback are indicated above.


