


To open long positions on EURUSD, you need:
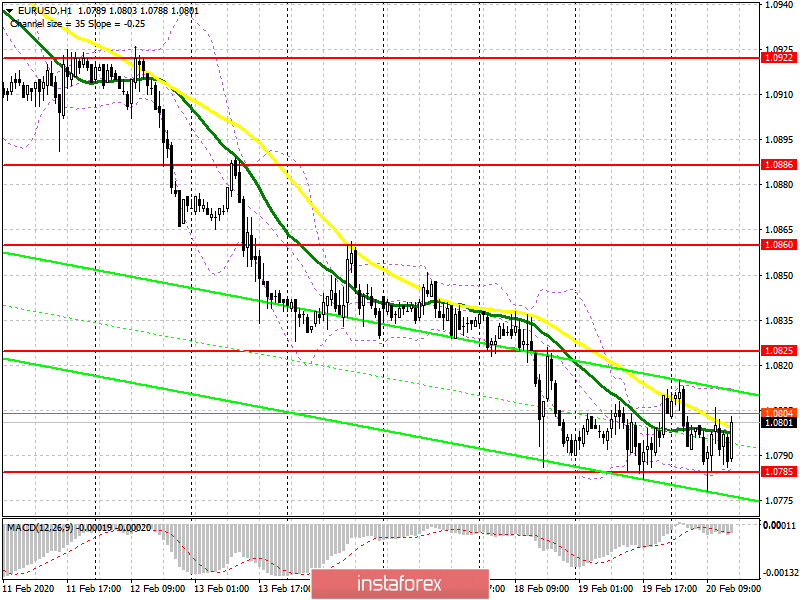
Data on German producer prices helped keep the euro at this year's lows, forming a false breakdown from the support area of 1.0785, which also led to the formation of a divergence on the MACD indicator. This is a bullish signal, however, given the current position of the European currency, it is not necessary to count on strong upward momentum. In the scenario of a breakthrough and a decline below the level of 1.0785 in the afternoon, it is best to return to long positions after the area of 1.0765 is updated or immediately to a rebound from the larger low of 1.0740. An equally important task for the bulls will be to break through and consolidate above the resistance of 1.0825, from which a good upward correction will be formed in the area of the highs of 1.0860 and 1.0886, where I recommend taking the profits.
To open short positions on EURUSD, you need:
The bears continue to bend their line, however, they have not managed to break below the support of 1.0785 for the third day in a row, which may lead to a sharp rebound of the pair up. Apparently, the sellers are counting on good reports on the US economy, which are scheduled for the second half of the day, since only a break in the support of 1.0785 will drop EUR/USD in the area of the lows of 1.0765 and 1.0740, where I recommend fixing the profits. In the scenario of the pair's growth in the second half of the day, only the formation of a false breakdown in the area of 1.0825 will signal the opening of short positions in the euro. I recommend selling immediately for a rebound only after testing the maximum of 1.0860.
Signals of indicators:
Moving averages
Trading is conducted in the area of 30 and 50 moving averages, which indicates market uncertainty in the short term.
Bollinger Bands
Volatility remains at a low level, which plays on the side of sellers of the European currency.
Description of indicators
- Moving average (moving average determines the current trend by smoothing out volatility and noise). Period 50. The graph is marked in yellow.
- Moving average (moving average determines the current trend by smoothing out volatility and noise). Period 30. The graph is marked in green.
- MACD indicator (Moving Average Convergence / Divergence - moving average convergence / divergence) Fast EMA period 12. Slow EMA period 26. SMA period 9
- Bollinger Bands (Bollinger Bands). Period 20


