Hello, dear colleagues!
Today's statistics from Japan were released within the expectations of market participants. The national consumer price index, excluding fresh food prices, and the national consumer price indices were 0.8% and 0.7%, respectively.
However, it doesn't matter anymore. What happened this week with the dollar/yen currency pair is nothing short of a breakthrough. The main reason for the fall of the Japanese currency is the reduction of fears about the spread of the coronavirus epidemic. Against this background, the yen as a safe asset loses its appeal. However, the fight against the coronavirus is not over yet and such dynamics of USD/JPY were more influenced by technical factors.
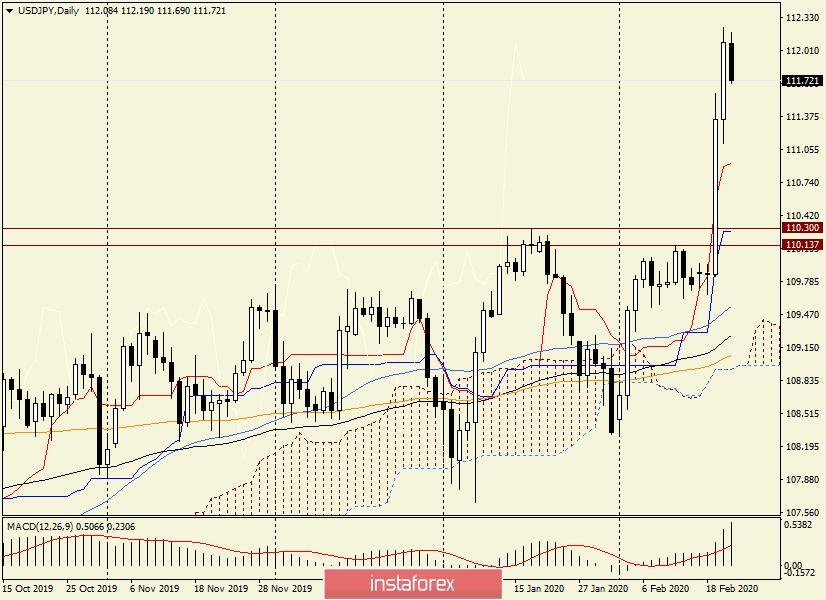
Daily

Despite weak reports on Japan's GDP, which were published on Monday, February 17, the fall of the Japanese currency fell in the previous two trading sessions.
After such a long-term consolidation under the key psychological and technical level of 110.00, something similar should have happened: either a breakthrough or a fall. The market chose the first option. In my opinion, the demand for the US currency is more important here. The US dollar is a favorite across a wide range of currency markets. This is understandable and beyond doubt.
A little surprising is the strength of the pair's growth, which at the moment of writing is trading near another strong and significant level of 112.00. If today's and weekly trading closes above this mark, the pair's bulls will further indicate their strength and willingness to move the price higher.
Although everything is clear on the daily chart. A strong and confident breakout of the strong resistance zone of 110.14-110.30 leaves no doubt about the bullish ambitions and continued growth. Now the main task for those who trade this pair is to enter the market. Naturally, we are talking about purchases. I would like to open long positions not at the peak of the market but after a corrective pullback.
If we assume that such a rollback will be given, then, according to daily, the price zone near 111.00 looks good for purchases, where the Tenkan line of the Ichimoku indicator is located just below.
However, as I have repeatedly pointed out, after such strong movements, the correction is quite insignificant or even can take place in a relatively narrow side range. However, we must always count on other developments.
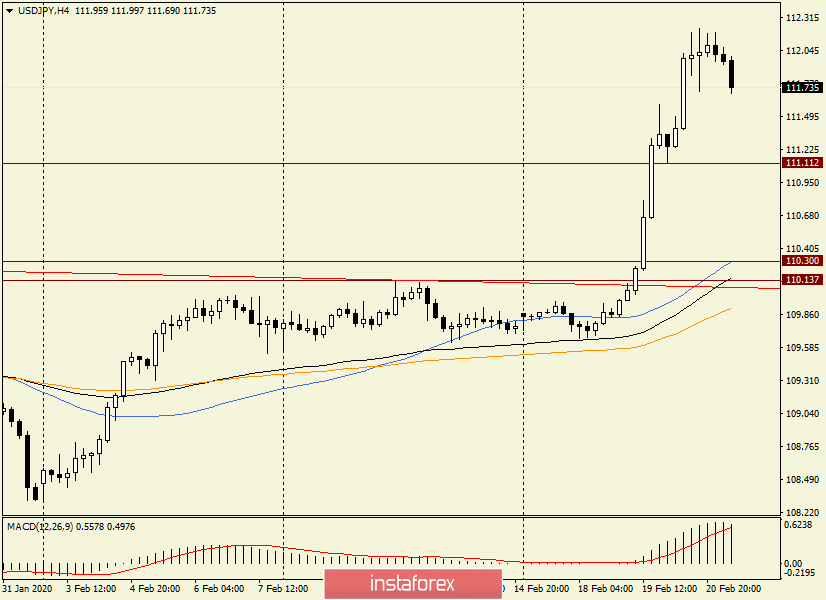
H4

On this timeframe, after a combination of candles with long shadows, there was a reversal for a corrective pullback, and the pair is currently moderately declining.
I don't think we should expect a pullback to the broken resistance level of 110.30. If this happens, you can think about the fact that this shot up was a blank. That is, in the case of a pullback to 110.30 and the price returns to this level, the strongest break up will have to be recognized as false.
The most real will be a decline to the support level of 111.11, where you should prepare for purchases of USD/JPY. Although even such a correction will be too deep.
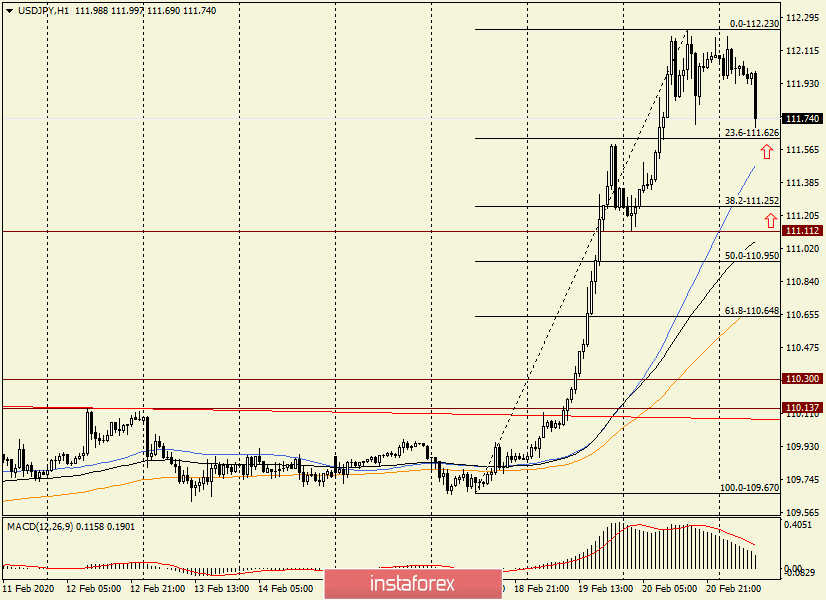
H1

The hourly chart is the most suitable for finding entry points to the market. If you stretch the Fibonacci grid to the growth of 109.67-112.23, the most suitable area for opening long positions is 111.65-111.50. As you can see, the level of 23.6 Fibo from the specified growth is passed here, and the simple moving average is slightly below 50.
The further price zone of 111.25-111.15 for purchases technically looks good. In the designated zone, there is a brown support level, 38.2 Fibo from the growth of 109.67-112.23, and a slightly lower 89 exponential moving average.
By the time the review was completed, the decline had increased and became more aggressive, which is a bit strange for a corrective pullback. Nevertheless, purchases remain the main trading idea for the USD/JPY pair.
Good luck!


