


EUR/USD – 1H.
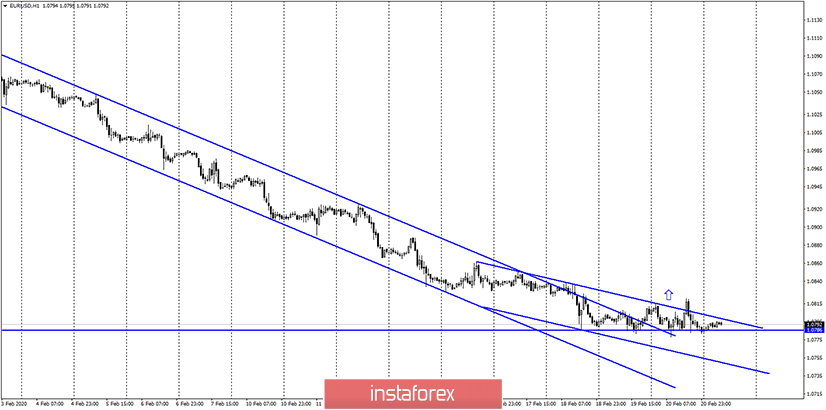
Hello, traders! According to the hourly chart, the quotes of the EUR/USD pair left the first downward trend corridor. Moreover, they are now willing to leave the second corridor with a smaller angle of inclination. By itself, the second corridor already indicates a slowdown in the fall of the European currency – a harbinger of a change in the direction of the trend. Thus, the closing of the pair's rate over this corridor will be a relatively strong signal to buy. However, at the same time, I note that the pair has not been able to continue falling or start rising for the past few days. And in such a situation, all graphical and technical signals can pass by traders. But a stronger signal now is the line of 1.0786, which bear traders have been unable to break through in recent days. Fixing quotes below it will significantly increase the likelihood of further falls. Otherwise, I will wait for the pair to grow.
EUR/USD – 4H.
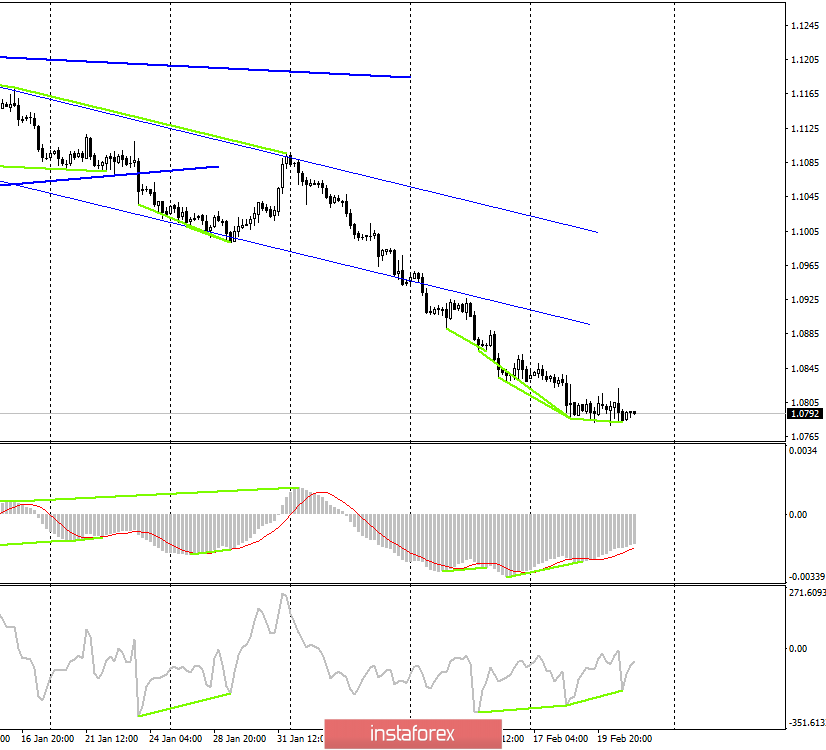
On the 4-hour chart, the drop in quotes was stopped by three bullish divergences at the MACD and CCI indicators. Divergences are corrective, as they warn of a counter-trend movement. However, in conjunction with the indications of other charts, it can still be assumed that traders have reached the bottom of the euro/dollar pair. Thus, the "bearish" mood of traders remains but the euro is still unlikely to fall forever. Sooner or later, traders will "find" the bottom. And why shouldn't it happen now?
EUR/USD – Daily.
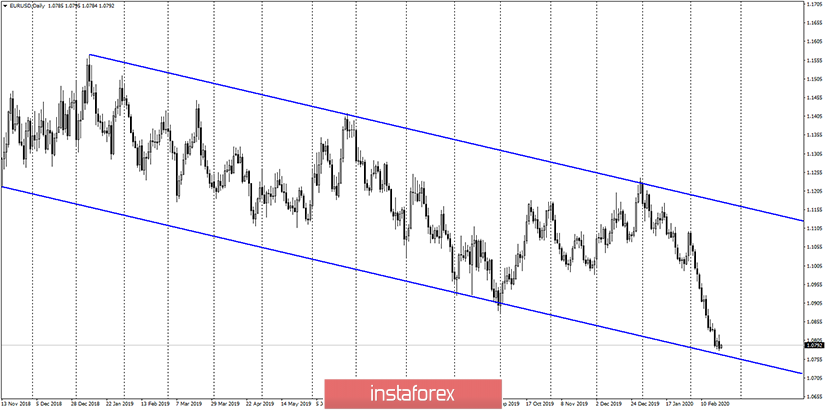
On the daily chart, the euro/dollar pair is also in the process of falling. The EUR/USD pair dropped to the lower trend line of the downward corridor. Thus, the graphic picture also indicates on the daily chart that the "bearish" mood of traders is still maintained. At the same time, a rebound from the lower line of the corridor will be a strong signal for a counter-trend movement in the direction of the upper line of the corridor.
EUR/USD – Weekly.
The weekly chart shows that the pair is now at a fork. Rebounding from the level of 1.0767 (the approximate point of contact with the lower line of the tapering triangle) will work in favor of the EU currency and the beginning of the pair's growth on all charts with different goals. For the weekly chart, the goals will be located near the top line of the triangle.
Overview of fundamentals:
On February 20, several economic reports in Germany, the European Union, and America were insignificant. This was known initially, so traders did not wait for this data and did not pay any attention to them.
News calendar for the United States and the European Union for February 21:
Germany - index of business activity in the manufacturing sector (08:30 UTC+00).
Germany - index of business activity in the service sector (08:30 UTC+00).
EU - index of business activity in the manufacturing sector (09:00 UTC+00).
EU - index of business activity in the service sector (09:00 UTC+00).
EU - consumer price Index (10:00 UTC+00).
USA - index of business activity in the manufacturing sector (14:45 UTC+00).
USA - index of business activity in the service sector (14:45 UTC+00).
All business activity indices are preliminary since February is not yet complete. However, business activity values that differ greatly from forecasts can lead to a strong reaction from traders.
COT survey (Commitments of traders):
For the week of February 11, short positions of large speculators increased by only 2146 contracts, while long positions increased by 20622. This means that the largest market players are beginning to prepare for a reversal, increasing purchases. The total number of commercial long positions outweighs short positions. Although the total number (total) is still dominated by sales. The conclusion of the latest COT report remains the same: the largest players who do not use the foreign exchange market for speculative profit are increasing their purchases. Speculators, hedge funds and traders continue to short the pair. The fall of the euro will slow down, which coincides with the readings of the hourly and 4-hour charts. A new COT report will be released today.
Forecast for EUR/USD and recommendations for traders:
The trading idea is still to buy the euro. However, it requires signals from at least two charts. Each of the four charts there seems to provide signals to buy the euro. The COT survey also warns that trader sentiment can change.


