


To open long positions on EUR/USD you need:
The upward correction in the European currency remains steady as the pair reached last Friday's highs again. Despite the fact that the pressure on the euro increased yesterday morning, the bulls managed to form the lower border of the new upward channel indicating that the uptrend is likely to continue. In early European session the German GDP data will come under spotlight. If the data is better than forecast, the euro is expected to reach the resistance level of 1.0886. As a result, the price is expected to climb to the high of 1.0922. This is the level where you can take profit. If the data is weak, only a false breakout to the support level of 1.0846 will signal that you can open long positions only on EUR/USD. It is better to buy immediately once the price rebounds from the lower border of the upward channel that coincides with the support level of 1.0814.
To open short positions on EUR/USD you need:
In the first half of the day, sellers of the euro are targeted to return the pair to the support level of 1.0846. In this case, German GDP data can be beneficial. If the price consolidates below this range, the euro is likely to drop to the low of 1.0814. This is the level where you can take profit as buyers will be active again. In case of the breakout of the level, the EUR/USD pair can find support near 1.0780. If the price continues rising in the morning, you can open short positions only after a false breakout is formed in the support area of 1.0886. However, it is better to sell the euro immediately on the rebound from a high of 1.0922.
Signals of indicators:
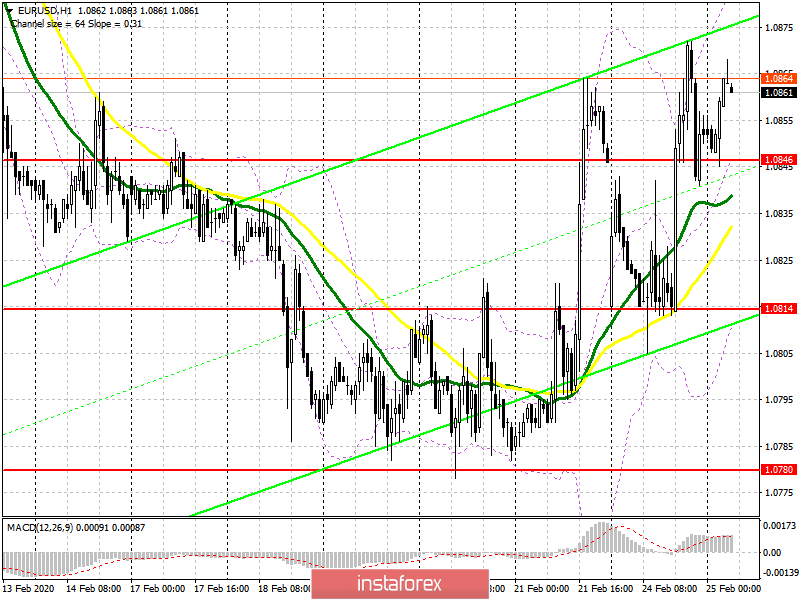
Moving averages
Trading is above 30 and 50 moving averages which signals that the upward correction of the euro is likely to continue. In case the price falls, the moving averages will also act as support.
Bollinger bands
Growth is expected to be limited by the upper level of the indicator at 1.0886. If the pair drops, you can buy on a rebound from the lower border of the indicator in the area of 1.0812.
Description of indicators
- Moving average (moving average determines the current trend by smoothing out volatility and noise). Period 50. The line is marked in yellow.
- Moving average (moving average determines the current trend by smoothing out volatility and noise). Period 30. The line is marked in green.
- MACD indicator (Moving Average Convergence/Divergence) Fast EMA period 12. Slow EMA period 26. SMA period 9
- Bollinger Bands. Period 20


