To open long positions on EURUSD, you need:
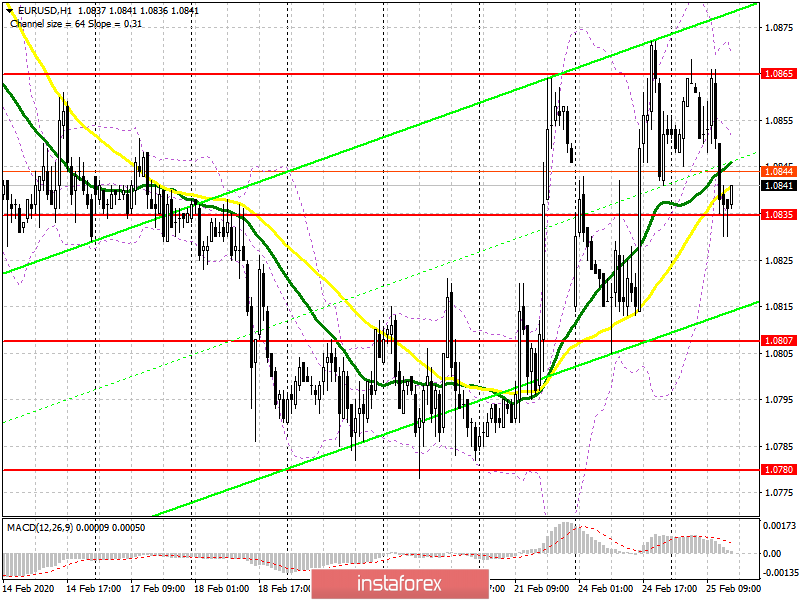
Buyers of the euro made an attempt to break yesterday's highs in the area of 1.0865, where a fairly large level of resistance is already visible. Apparently, the weak report on the growth of the German economy did not allow the bulls to break above this range. For the second half of the day, the task is more significant. It is necessary to stay in the middle of the side channel in the area of 1.0835, a decrease under which will quickly push the euro to a minimum of 1.0807, from where I recommend opening long positions immediately for a rebound. The lower border of the ascending channel formed from this year's lows also passes there. To return to the bullish market, a breakdown of the resistance of 1.0865 is required, which will lead EUR/USD to update the highs around 1.0895 and 1.0925, where I recommend taking the profits. Data on the consumer confidence indicator in the United States may contribute to the growth of the euro, provided that the indicator will be worse than economists' forecasts.
To open short positions on EURUSD, you need:
Data on German GDP growth coincided with economists' forecasts and did not greatly help the sellers of the euro. Bears need a breakdown in the second half of the day and a consolidation below the support of 1.0835, which will increase pressure on the euro and lead to an update of the lows of 1.0807 and 1.0780, where I recommend taking the profits. However, the demand for the US dollar will return only if there is a very good indicator of consumer confidence in the United States. The small correction that has been observed recently is clearly not enough to break the annual lows and build new bearish momentum. It is best to postpone short positions until a false breakdown is formed in the resistance area of 1.0865 or sell EUR/USD already on a rebound from the maximum of 1.0895.
Signals of indicators:
Moving averages
Trading is conducted in the area of 30 and 50 moving averages, which indicates market uncertainty in the short term.
Bollinger Bands
A break of the lower border at 1.0835 will lead to a further decline in the euro. In the case of a sharp increase in the euro in the afternoon, the upper border of the indicator in the area of 1.0875 will act as resistance.

Description of indicators
- Moving average (moving average determines the current trend by smoothing out volatility and noise). Period 50. The graph is marked in yellow.
- Moving average (moving average determines the current trend by smoothing out volatility and noise). Period 30. The graph is marked in green.
- MACD indicator (Moving Average Convergence / Divergence - moving average convergence / divergence) Fast EMA period 12. Slow EMA period 26. SMA period 9
- Bollinger Bands (Bollinger Bands). Period 20


