


USD/JPY is trading at 113.65 level at the time of writing and is fighting hard to rebound after finding strong support. In the short term, it is moving somehow sideways, developing a triangle. A downside breakout from this pattern indicates a larger correction, while an upside breakout announces an upside continuation.
In the early morning, the Japanese stock index, the Nikkei rallied after some poor Japanese economic data. The Tokyo Core CPI increased by 0.1% in October versus 0.3% expected, the Prelim Industrial Production dropped by 5.4% in September versus a 2.8% drop forecasted, the Housing Starts rose by only 4.3% compared to 7.8% estimates, while the Consumer Confidence was reported at 39.2 points below 40.4 forecasts.
USD/JPY Triangle Pattern!
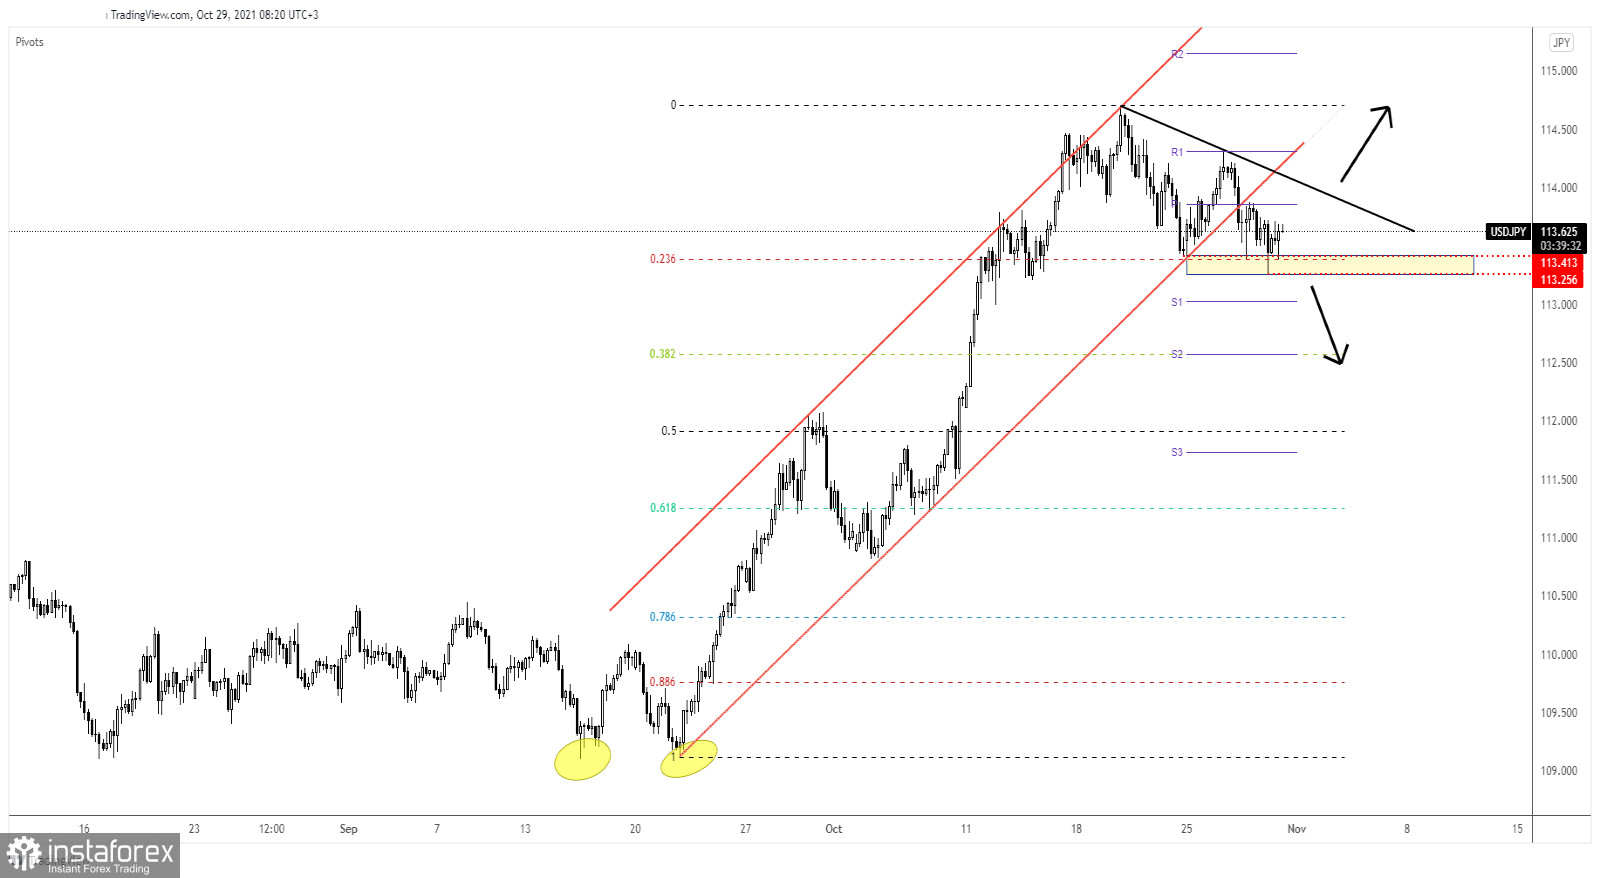
The USD/JPY pair registered new false breakdowns below 113.41 which represents static support. Also, it has registered only false breakdowns below the 23.6% retracement level. So, in the short term, we have a strong support zone.
It has developed a potential triangle between the 23.6% retracement level and the downtrend line. The USD/JPY could continue to move sideways before making a valid breakout in one direction.
USD/JPY Forecast!
The USD/JPY pair could bring new selling opportunities if it makes a new lower low, if it drops and closes below the 113.25 level. This scenario could signal a potential drop towards 112.57.
On the other hand, moving sideways above the 23.6% retracement level and making a valid breakout above the downtrend line could signal an upside continuation and could bring new long opportunities.


