


Trend analysis (Fig. 1).
Today, from the level of 1.3007 (closing yesterday's candle), a downward movement is possible with the first target of 1.2954, the retracement level of 38.2% (blue dashed line). If this level is reached, a continuation of work upwards with the target of 1.3018, the upper fractal (blue dashed line).
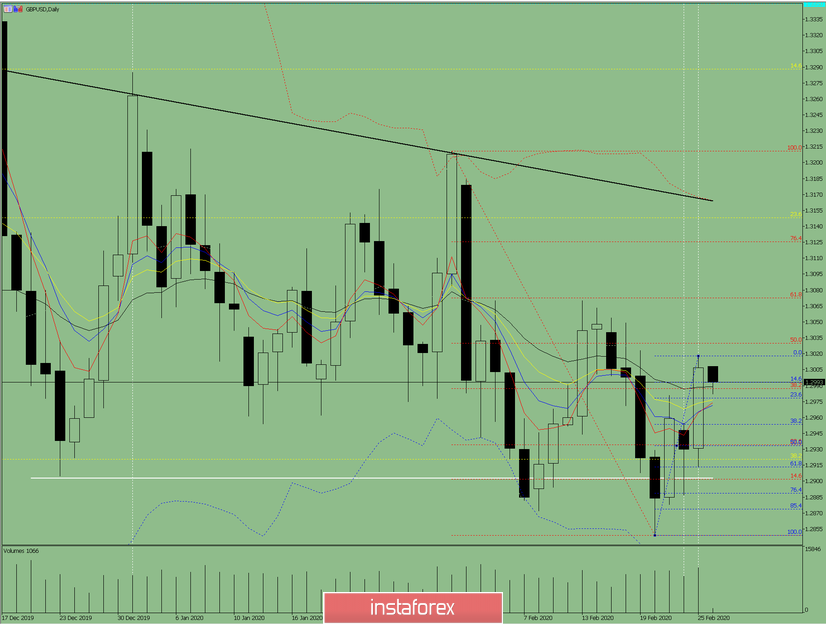
Fig. 1 (daily chart).
Comprehensive analysis:
- Indicator analysis - down;
- Fibonacci levels - down;
- Volumes - down;
- Candlestick analysis - down;
- Trend analysis - up;
- Bollinger Lines - up;
- Weekly schedule - up.
General conclusion:
Today, the price may roll back down.
An unlikely scenario is from a pullback level of 23.6% equivalent to 1.2978 (blue dashed line), work up with the target of 1.3018, the upper fractal (blue dashed line).


