


Good day!
I haven't looked at the euro/yen cross rate charts for a long time. Maybe this is a plus since the most significant technical nuances immediately catch your eye.
As I wrote in a previous article, today is a triple closure. The market will finish trading for the month, week and today. Let's see how well EUR/JPY approaches this event. Let's start with a weekly chart to determine the options for closing the session on February 24-28, and try to predict the future direction of this interesting cross-rate.
Weekly
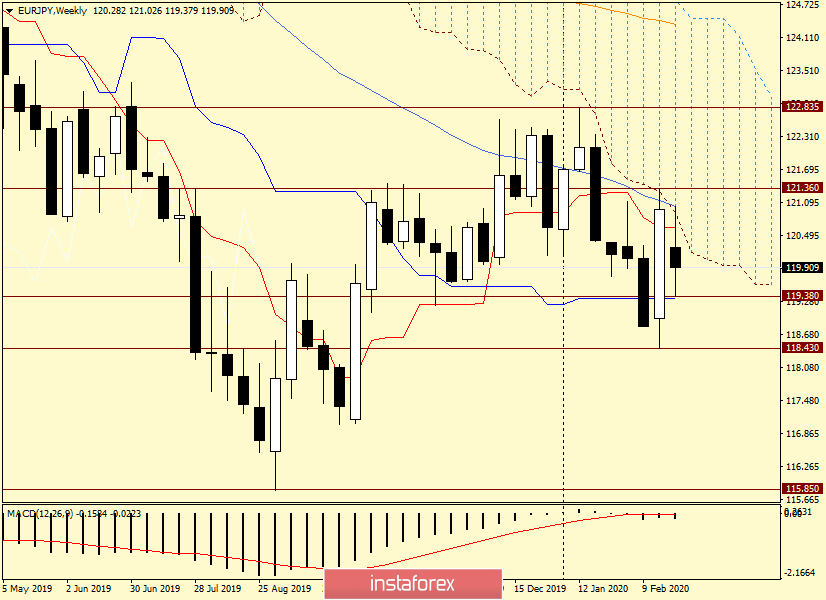
The weekly chart shows a rather unusual picture. After the previous huge white candle, the current week's trades opened with a bearish gap, and at the time of writing, this week's candle is inside the body of the previous one. In its form, this model is called "Harami" and often turns the price movement. However, the strength and chances of working out appear when this model occurs at the end of an upward or downward movement. In addition, it requires confirmation.
At the moment, the market went down to the level of 119.38 and rose up to 121.02. As a result, the euro/yen is now trading near the key psychological and technical level of 120.00. I dare to assume that it is around this mark that the struggle for the closing price will unfold.
The shadows at the top and bottom are approximately equidistant from the opening price. The growth was stopped by the Tenkan line, the lower border of the Ichimoku indicator cloud, and the 50 simple moving average, which together represent quite a serious resistance for players to increase the rate. At the bottom, support was found at 119.38, just below the Kijun line of the Ichimoku indicator.
Judging by the weekly chart, it is difficult to assume the further direction of the euro/yen. I will only note that in my personal opinion, it will be more problematic to break through due to the greater number of resistances.
Let's move to smaller time intervals in the hope of finding at least some signals for opening positions on EUR/JPY. I would like to immediately recommend that those who are new to the market, do not get into such volatile crosses, which include the euro/yen. Here you can get a decent profit, but also incur huge losses, up to the drain of the entire deposit.
Daily
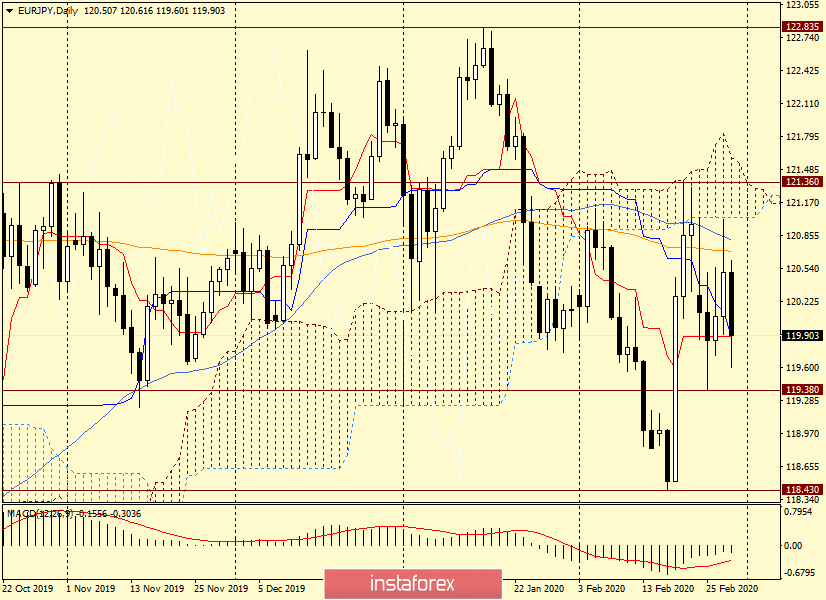
On this chart, we see that the situation is controlled by bears who are trying to lower the rate below the Tenkan and Kijun lines. These lines try to provide support, but we will be able to see and understand what will come out of all this only after the end of the trading session.
At the top, the resistance is represented by 144 exponential and 50 simple moving averages, just above where the lower boundary of the Ichimoku cloud passes. On this chart, the situation is also far from clear.
I can only assume that the breakdown of Tenkan and Kijun will send the pair to the support level of 119.38, the breakdown or non-breakdown of which the further direction of the euro/yen will depend. If the indicated level is broken, the next target for the bears will be 118.43, where the minimum trading values were shown on February 18.
Now about the bullish scenario, which also needs to be considered and taken into account. To confirm their ambitions and control over the pair, the bulls will have to break through 144 EMA, 50 MA, enter the limits of the Ichimoku cloud, break through the resistance of sellers at 121.36 and bring the price up their cloud. In my personal opinion, this is a very complex and large-scale task that will require a strong driver to solve. Let's see if the market can find it.
I will add that the area near 121.30 is very strong, and those who like to dig into history can see this.
In my opinion, the top-down scenario has the highest priority. Moreover, we should not forget that the yen is a safe haven currency, and in a situation with the spread of the ill-fated coronavirus around the world, it can receive additional preferences in the form of strong demand during the flight from risks.
Have a nice weekend!


