


Trend analysis
This week, the price is likely to rise to the target level of 1.1127 which is the downward resistance line (the red bold line). If the price reaches the target it can rebound to the level of 1.1075, the pullback level of 14.6% (red dash line).
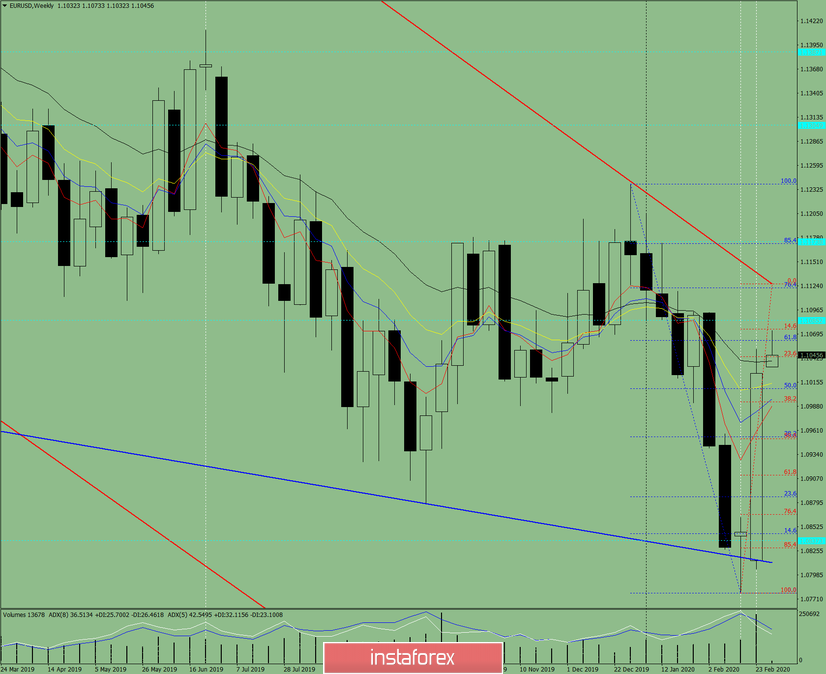
Fig.1. Weekly chart
Comprehensive analysis
- indicator analysis – up
- Fibonacci level – up
- volumes– up
- candlestick analysis – up
- trend analysis – up
- Bollinger Bands – down
- monthly chart – up
Comprehensive analysis conclusion - the upward trend is expected
The general total of the EUR/USD candlestick calculation based on the weekly chart: an upward movement with the absence of the first lower shadow near the weekly white candlestick (the price is expected to rise on Monday) and the presence of the second upper shadow (the price is likely to drop on Friday) is expected this week.
The low-probability scenario: the price is expected to rebound from 1.1062, or 61.8%, (blue dash line) to the lower target level of 1.0951 which is also the pullback level of 38.2% (red dash line).


