


The pair continued to move down on Friday, testing a pullback level of 50% equivalent to 1.2553 (yellow dashed line). Today, strong calendar news for the pound is expected at 09:30 UTC, and for the dollar at 15:00 UTC. The price may continue to move down.
Trend analysis (Fig. 1).
Today, from the level of 1.2818 (closing of the Friday afternoon candle), a downward movement is possible towards the support line of 1.2661 (red bold line). If this level is reached, work up with the target of 1.2743, the retracement level of 14.6% (red dotted line).
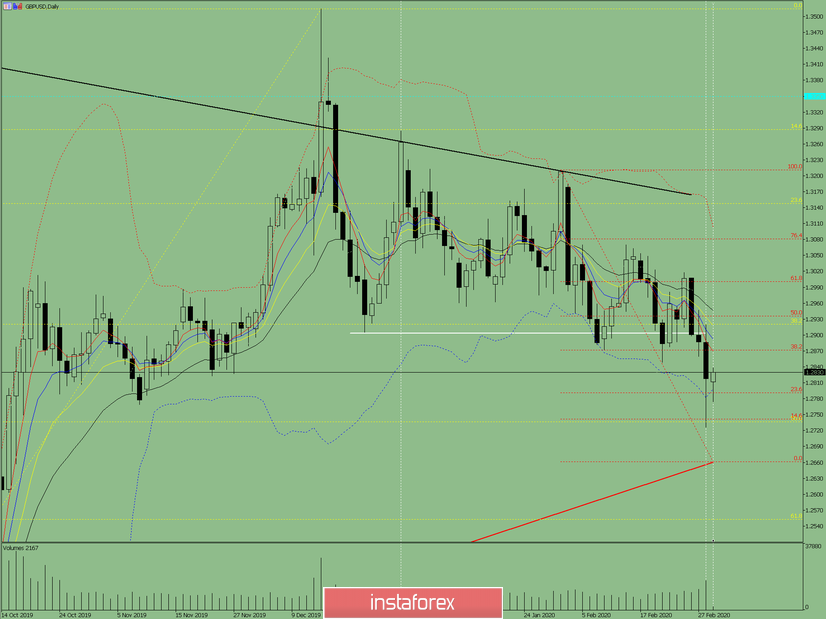
Fig. 1 (daily chart).
Comprehensive analysis:
- Indicator analysis - up;
- Fibonacci levels - down;
- Volumes - down;
- Candlestick analysis - the top;
- Trend analysis - down;
- Bollinger lines - down;
- Weekly schedule - down.
General conclusion:
Today, the price may continue to move down.
An unlikely scenario is from the level of 1.2818 (closing of the Friday afternoon candle), work up with the target of 1.2936, the pullback level of 50% (red dashed line).


