


Hello, traders!
That's the end of the winter calendar and the February auction closed. In this review, we will analyze the results of the closing of the last winter month and the previous five-day trading period.
Monthly
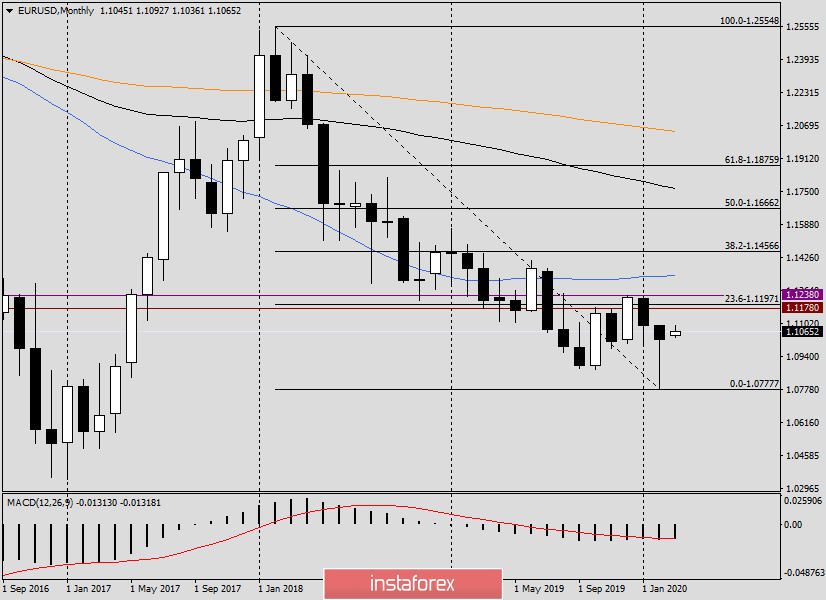
The candle that was formed at the end of February trading can not be called otherwise than a reversal. This refers to the shape of the candle itself with a huge lower shadow or tail. Naturally, there is nothing special to deploy here (on a monthly TF). Recently, candlesticks have been alternating and there have been no pronounced directional dynamics as such.
The bears' attempt to push through the key support level of 1.0879 failed. After the appearance of candles, there is a subsequent growth of the quote. If this happens, it would be a good idea to determine the immediate goals of the expected strengthening of the euro/dollar. This is why I stretched the Fibonacci tool's grid to a decrease of 1.2555-1.0777. As you can see, the first pullback level of 23.6 passes near the strong technical mark of 1.1200, near which the euro bulls already had difficulties with further rate rises due to strong resistance from sellers in the price zone of 1.1178-1.1238.
Given the fact that the bears did not cope with their task, we can assume that now the control of the pair will pass to their opponents, which means that the most likely scenario for the first spring month will be the growth of euro/dollar in the area of 1.1200, where the further direction of the pair can be determined. A census of last year's December highs of 1.1238 will open the way to higher targets, which are at 1.1338 and 1.1456, where the 50 simple moving average and the 38.2 Fibo level from the indicated decline pass. This applies to the prospects for EUR/USD on the monthly timeframe. Now let's see what the picture is on the smaller timeframes.
Weekly
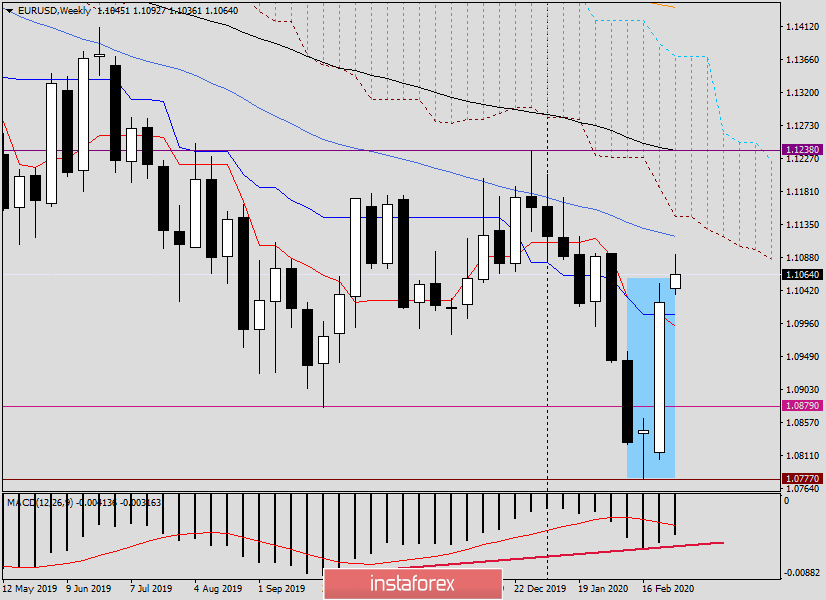
The article on euro/dollar a week ago indicated the possibility of a reversal of the pair in the north direction after the formation of the "Hammer" candlestick model. At the same time, it was noted that such models often require confirmation.
At the auction on February 24-28, as a result of the impressive growth, the reversal was confirmed. Now the question is: is this a reversal on the course correction or a change in the trend? In truth, I'm more inclined to the second option.
However, this is not a fact. At the top, there are strong resistances, which will be difficult for euro bulls. I will list the nearest of them: the resistance level of 1.1095, 1.1118 (50 MA) and the lower border of the Ichimoku indicator cloud, which this week passes at 1.1146. If you designate higher goals at the top, then you can include the levels of 1.1178, 1.1200, 1.1223 and 1.1238. In my opinion, the breakdown of the last mark will finally indicate bullish sentiment for the euro/dollar.
An alternative top-down scenario is unlikely in the current situation. However, if trading in the first week of spring ends with a decline and closes below the Tenkan and Kijun lines, then the bears on the pair will again have chances to take control of the market. At the moment, they have thrown out a white flag.
Daily
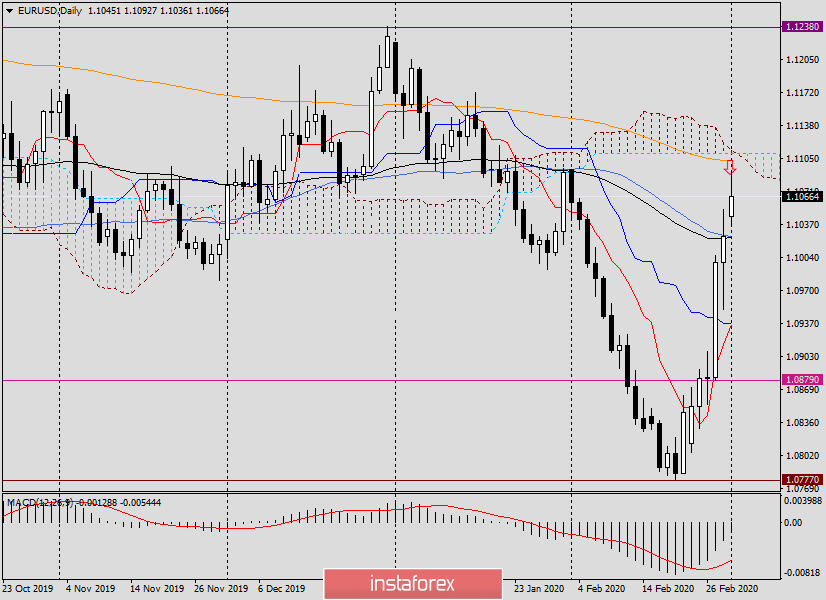
Now let's move on to the daily timeframe. Here, we see that the rise of February 28 at 1.1025 was stopped by 89 exponential and 50 simple moving averages. However, today's trading opened with a gap up. At the end of the review, the pair is trading near 1.1065 and is going to continue the upward movement. Friday's highs have already been rewritten at 1.1053. If the rise continues, the next target will be the area of 1.1095-1.1110, where the resistance level and the lower border of the Ichimoku cloud are located. The further benchmark for players to increase the rate is at 1.1125. Here is a 200 exponential moving average that can trigger a corrective pullback. Bearish patterns of Japanese candlesticks on the four-hour and (or) hourly charts signal this development.
Conclusion and recommendations.
Judging by the technical picture, the EUR/USD pair is likely to continue its upward movement towards the goals indicated in this review.
Naturally, in this scenario, purchases are considered the main trading idea, which can be looked at after corrective declines to 1.1040,1.1020, 1.1000, and possibly to 1.0975.
Tomorrow we will return to the main currency pair of the Forex market, as well as identify the main macroeconomic events for euro/dollar this week.
Good luck with trading!


