


To open long positions on EURUSD, you need:
Activity on the part of euro buyers decreased after the report on eurozone inflation, which continues to slow down, causing the European Central Bank even more problems. In the second half of the day, the bulls need to return to the resistance level of 1.127 in order to count on a repeat attempt to update the maximum in the area of 1.1180, a breakthrough of which will lead EUR/USD to the new levels of 1.1210 and 1.139, where I recommend taking the profits. In the scenario of a further downward correction, and we only have a G7 meeting scheduled for the second half of the day, it is best to return to long positions after forming a false breakdown in the area of 1.1084 or buy the euro immediately for a rebound from the minimum of 1.1042, where the bulls will try to form the lower border of the current upward trend from February 21.
To open short positions on EURUSD, you need:
Sellers are gradually pushing the euro and have already managed to pick up the level of 1.127. While trading is below this range, you can expect a further decline to larger support of 1.1084, as well as an update to the minimum of 1.1042, where I recommend taking the profits. The absence of important fundamental statistics on the American economy will allow us to maintain the advantage of sellers. In a scenario of growth of EUR/USD above the resistance of 1.1127 during the second half of the day, it is best to return to short positions to rebound from a maximum of 1.1180 or sell the euro even higher from levels 1.1210 and 1.1239 with the aim of a slight correction of 20-30 points inside the day.
Signals of indicators:
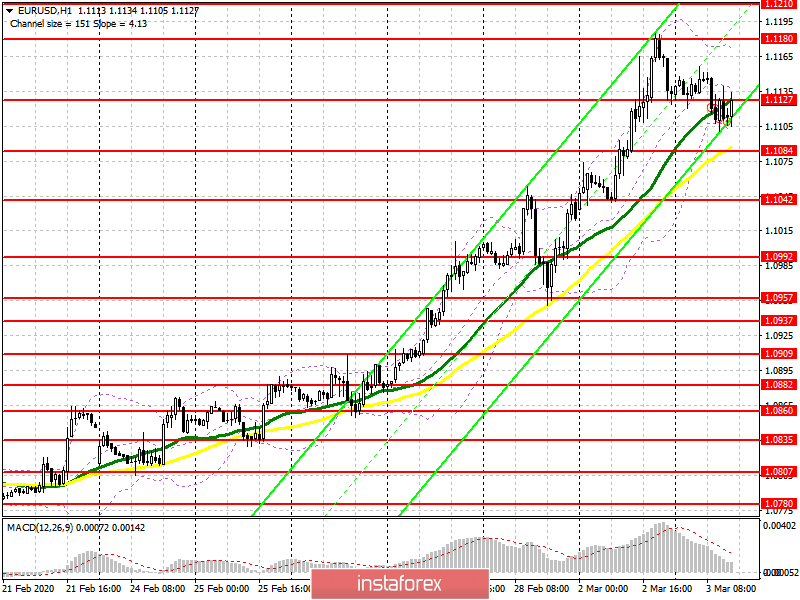
Moving averages
Trading is conducted in the area of 30 and 50 moving averages, which limit the downward correction in the pair.
Bollinger Bands
A break of the lower border of the indicator in the region of 1.1110 will increase pressure on the euro, and growth will be limited by the upper level in the region of 1.1175, where you can see sales.
Description of indicators
- Moving average (moving average determines the current trend by smoothing out volatility and noise). Period 50. The graph is marked in yellow.
- Moving average (moving average determines the current trend by smoothing out volatility and noise). Period 30. The graph is marked in green.
- MACD indicator (Moving Average Convergence / Divergence - moving average convergence / divergence) Fast EMA period 12. Slow EMA period 26. SMA period 9
- Bollinger Bands (Bollinger Bands). Period 20


