


Trend analysis (Fig. 1).
Today, from the level of 1.2754 (closing of yesterday's candle), a downward movement is possible with the target of 1.2737, a pullback level of 50.0% (yellow dashed line). If this level is reached, continued work down with the target at the support line of 1.2668 (red bold line).
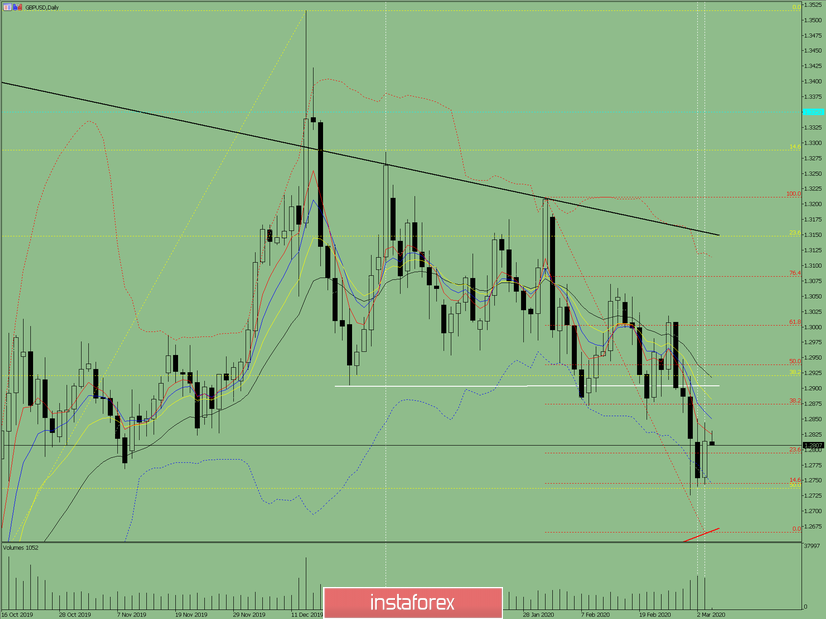
Fig. 1 (daily chart).
Comprehensive analysis:
- Indicator analysis - down;
- Fibonacci levels - down;
- Volumes - down;
- Candlestick analysis - the top;
- Trend analysis - down;
- Bollinger lines - down;
- Weekly schedule - down.
General conclusion:
Today, the price may continue to move down.
An unlikely scenario is from the level of 1.2814 (closing of yesterday's candle) work up with the target of 1.2874, a retracement level of 38.2% (red dashed line).


