


4-hour timeframe
Amplitude of the last 5 days (high-low): 54p - 127p - 102p - 157p - 119p.
The average volatility over the past 5 days: 112p (high).
Over the past five weeks, the European currency, paired with the US dollar, has been moving as if the Forex market will soon cease to function and traders and investors will finally want to complete all their bids. At first, the euro fell without a break for three weeks, now the US dollar has been falling for the second week in a row. The most interesting thing is that these two movements cannot be called either fundamentally sound (at least in full), nor provoked by macroeconomic statistics, or absolutely technical. Perhaps, the logical fall in the euro in those three weeks was really logical, but obviously it should not be so strong without a single correction. What is happening in the last two weeks is generally very difficult to describe in words. The euro grew, breaking all the records of volatility every day. Even in those days when there was no news. The reasons were called the collapse of the US stock market, and the consequences of the coronavirus, as well as the possible lowering of the key Fed rate. And what is the result? The Fed immediately lowered its key rate by 50 basis points, and traders responded ... by closing the pair's purchases. That is, at the very moment when it was most logical to expect the European currency's growth. We also want to note once again that coronavirus affects not only the United States and the US stock market. It concerns all countries of the world, it concerns the European Union, it concerns the ECB, it concerns the European stock markets. However, for some reason, in recent weeks there has been a convenient version of the rationale for what is happening, they say, the fall of the US stock market is to blame. We consider this version incorrect, especially since initially the euro growth was exclusively corrective after a long fall. After that, the news began to come to the disposal of traders, which could not leave them indifferent and a kind of panic began on the markets. And when there is panic in the markets, there is no reason to talk about any logical movement of the pair. Therefore, we end up with what we have. There had to be a correction, but in the end, an upward trend began, which now, it is not clear whether it will continue or not. Most of the macroeconomic statistics of recent weeks have been ignored by market participants.
We would like to note in such an unfavorable situation amid the ongoing spread of the coronavirus that, in principle, easing monetary policies will not solve the problem of the disease itself. That is, these are just measures of the central banks to reduce the negative effects of the Chinese virus on the economies of their countries. The virus must be combated through medical means. Or trust Donald Trump, who stated that "there is nothing to fear (at least to the Americans)," and the virus "will not survive the warm season." Literally half an hour after the speech of the US president, medical experts said that the vaccine against the virus would be ready at best in a year, so Trump immediately fell upon a portion of criticism. Thus, if the virus continues to gain momentum, then all lower key rates will not have much effect on the world economy or the economies of individual countries. Moreover, the coronavirus affects all countries, and most likely the ECB and the Bank of England will lower their rates.
A lot of different information and macroeconomic data were published during the third trading day of the week. For example, data on retail sales were released in Germany and the European Union. The German indicator added 1.8% y/y, while the European one added 1.7% y/y. Both indicators were higher than forecasted values. Indices of business activity in the services sectors of Germany and the EU were worse than forecast values, as well as the values of the previous month - 50.7 and 52.6, respectively. But the macroeconomic statistics from across the ocean certainly pleased traders. If the Markit services business activity index remained below the key level of 50.0 and amounted to only 49.4, then the ISM services business activity index significantly exceeded the already rather high forecasts and amounted to as much as 57.3 points in February. The ADP report on the level of employment in the US private sector was also quite strong. The data showed an increase of 183,000 new workers with forecasts of +170,000. Thus, we can conclude that the statistics from the United States was strong today. It is on the basis of these data that the US dollar began to strengthen today. At least I want to believe in it. However, the downward movement of the pair is also brewing from a technical point of view, since a correction is simply necessary after such a strong upward movement. Based on the foregoing, the key question remains: have the markets calmed down after the panic? If so, then we are almost 100% but expect a downward movement, perhaps even quite strong. We believe that the euro is now overbought. If the panic has not yet passed and traders will continue to react to the fall of US stock indices or oil in the same way as they did in the last week, then it is generally difficult to imagine what could happen to the euro/dollar rate.
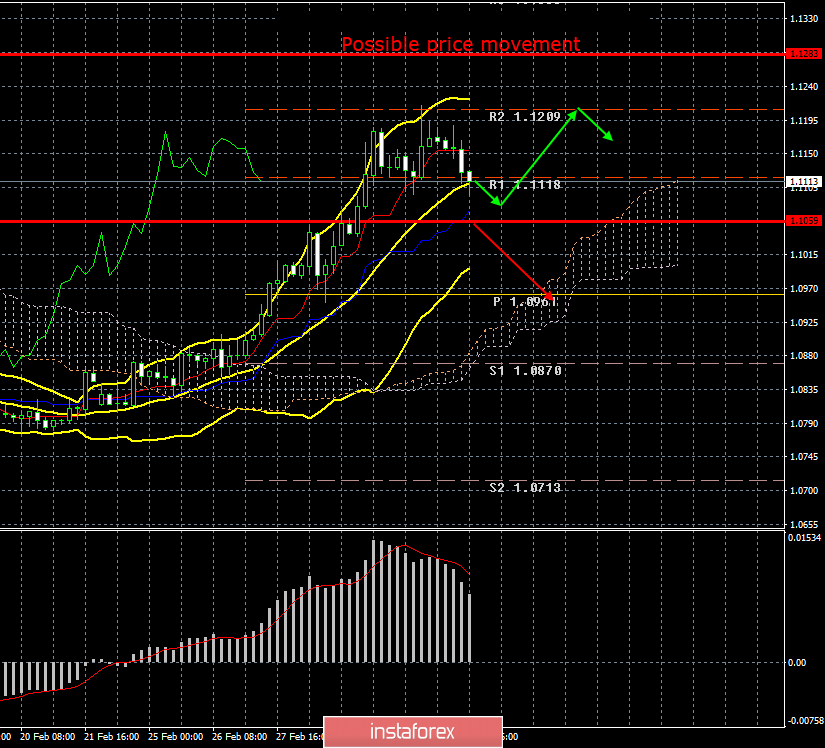
A correction began from a technical point of view. We believe that the upward movement is completed, however, above the Kijun-sen critical line, the upward trend continues. Accordingly, a rebound from Kijun-sen may trigger a new round of upward movement.
Trading recommendations:
The EUR/USD pair retains the same chances for the beginning of the correction and for the continuation of the upward movement. Thus, new long positions can be considered in case of a rebound from Kijun-sen with the target of the resistance level of 1.1209. However, from our point of view, this is rather dangerous, and this level has already been worked out. It will be possible to sell the pair with the first goal of the Senkou Span B line, when traders will be able to gain a foothold back below the critical line.
Explanation of the illustration:
Ichimoku indicator:
Tenkan-sen is the red line.
Kijun-sen is the blue line.
Senkou Span A - light brown dotted line.
Senkou Span B - light purple dashed line.
Chikou Span - green line.
Bollinger Bands Indicator:
3 yellow lines.
MACD indicator:
Red line and bar graph with white bars in the indicators window.
Support / Resistance Classic Levels:
Red and gray dashed lines with price symbols.
Pivot Level:
Yellow solid line.
Volatility Support / Resistance Levels:
Gray dotted lines without price designations.
Possible price movements:
Red and green arrows.


