


Trend analysis (Fig. 1).
Today, from the level of 1.2873 (closing of yesterday's candle), it is possible to move up with the target at the resistance level of 1.2904 (white bold line). In case of breaking through this level, a continuation of work up with the target of 1.2939, a pullback level of 50% (red dashed line).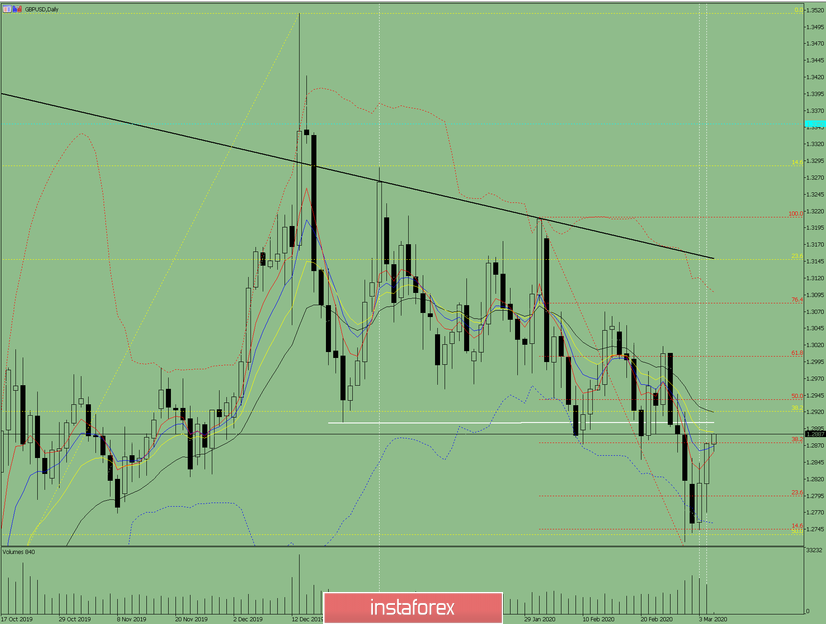
Fig. 1 (daily chart).
Comprehensive analysis:
- Indicator analysis - up;
- Fibonacci levels - up;
- Volumes - up;
- Candlestick analysis - the top;
- Trend analysis - down;
- Bollinger Lines - up;
- Weekly schedule - up.
General conclusion:
Today, the price may continue to move up.
An unlikely scenario is from the resistance level of 1.2904 (white bold line), work down with the target at the lower fractal 1.2770.


