


From a comprehensive analysis, we see that inertia has resumed its upward course, where the status of the medium-term trend is at risk. Now about the details. The 60-hour stop was not in vain. The bulls or rather the FOMO dependent ones managed to resume the upward movement, which led to the price approaching the peak of the correction on December 31 (1.1239) and as a result, a breakdown. In fact, we received a signal of a possible change in the medium-term trend, where if the price passes higher than 1.1400, this signal will get real ground for discussion. In all this, it is striking that such a significant change, based on statistics, takes considerable time. In our case, everything happened in 11 trading days. If we have such a strong acceleration, then the movement has the appearance of inertia, but when we have such a high rate of change, we are faced not only with inertia, but also with FOMO, and with an external background that does not allow us to think sensibly. "Hamster fuss" – this is how you can describe everything that is happening at this time with the European currency, since the problems of the EU have not gone away, and the locomotive jerked without a driver.
What should we do? First, do not give in to panic. Second, keep your finger on the pulse of the market. Third, prepare for an ice shower for hamsters that will lead to a reverse move. Now we are not talking about trends, we are in a maelstrom of events, and the most important thing is not to drown.
In terms of volatility, we see activity that should not have been for the euro/dollar pair, with such a long hold. Thus, the fact of FOMO and excessive noise is once again confirmed in the market.
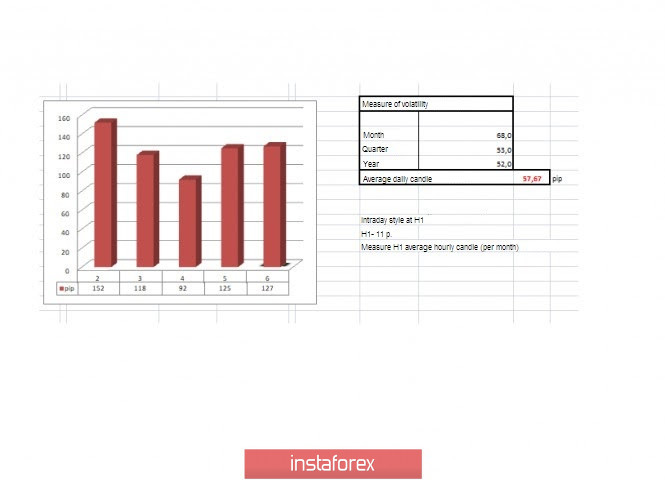
Volatility details: Thursday-127 points; Friday-102 points; Monday-152 points; Tuesday-118 points; Wednesday-92 points; Thursday-125 points. The average daily indicator, relative to the dynamics of volatility - 57 points (see the volatility table at the end of the article).
Analyzing the past day by the minute, we see that after the breakdown of the upper limit of the consolidation of 1.1120/ 1.1145, the upward movement resumes, which leads to inertia and convergence with the maximum of December 31.
As discussed in the previous review, traders are faced with a return to the framework of the recent flat, but this did not happen. Working on the noise and panic in local buy positions is a more attractive idea.
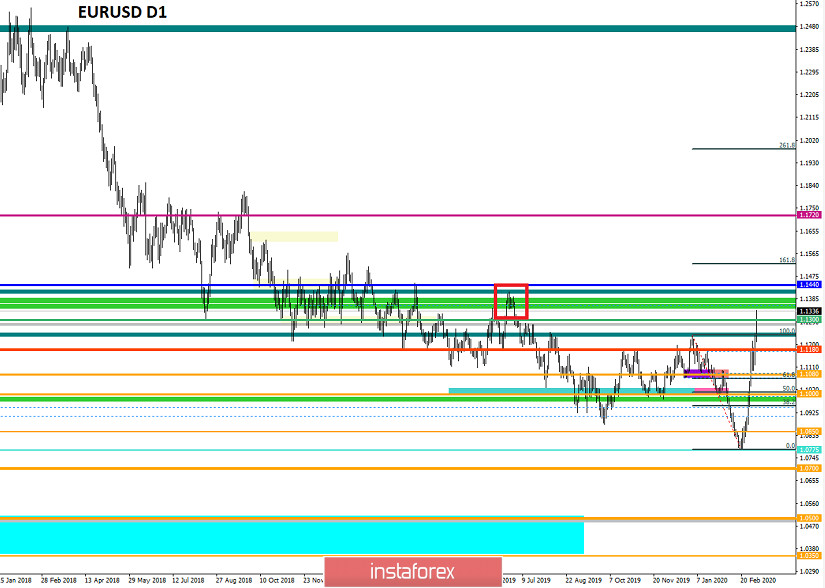
Looking at the trading chart in general terms (the daily period), we see just a vertical move. Without corrections and significant rollbacks, the value of all this is more than 500 points. If we switch to a weekly chart, similar activity was last seen in 2015.
The news background of the previous day included data on applications for unemployment benefits in the United States, where they almost coincided. The growth of applications +4 thousand: Primary -3 thousand; Repeated +7 thousand. At the same time, data on US production orders were released, where they recorded a decline of 0.5%.
The market's reaction to the statistics was somewhere inside the immense noise.
In terms of the general information background, we have a kind of hysteria in the media, where they are already actively discussing another possible Fed rate cut at the upcoming meeting on March 17-18. The created background leaves no chance for market recovery when the ECB meeting is still on the nose, with big and fat questions in the regulator's action plan.
In turn, the head of the Dallas Federal Reserve, Robert Kaplan, says that further rate cuts depend on the rate of spread of the coronavirus in the United States, which further alarms the market.
"The number of new cases of coronavirus infection will be a key factor, which, at a minimum, I will use when making a decision on whether... should we lower the rate even further at the Fed meeting, which will take place from March 17 to 18. Kaplan added that the usual economic data, which the Fed usually relies on when deciding on the rate level, is not very useful in such a rapid development of the situation," said the head of the Dallas Fed
We conclude the column with news from Brussels, where the EU's chief Brexit negotiator Michel Barnier summed up the first phase of negotiations between Europe and the UK. So he believes that the first round was successful, the goal to build a close partnership with Britain was set, as well as the launch of 11 negotiations in various areas. Of course, the process does not expect to be easy, there are differences. Now the second phase of Brexit negotiations has already started, says Michel Barnier.
Today, in terms of the economic calendar, we have a report from the Department of Labor in the United States, where they expect that 165,000 new jobs will be created in the non-agricultural sector, compared with the previous period, where 225,000 were created. At the same time, we will get data on the unemployment rate, where no changes are expected, as well as indicators for the average hourly wage, with a possible slowdown from 3.1% to 2.9%
This is not the best for the dollar, but due to the active growth of the euro, the confidence that with the release of statistical data for the US, the euro will fly into the stratosphere.

The upcoming trading week in terms of the economic calendar has one of the most interesting events for Europe - the ECB meeting, where, in view of past events, you can expect everything and even more. In terms of macroeconomic data, we have the final data of EU GDP and inflation data from the United States.
The most interesting events displayed below:
On Tuesday, March 10
EU 11:00 London time - GDP: Prev 0.9% ---> Forecast 1.2%
On Wednesday, March 11
USA 13:30 London time - inflation
On Thursday, March 12
ECB meeting, followed by a press conference
EU 11:00 London time - industrial output (y/y) (Jan)
USA 14:30 London time - applications for unemployment benefits
Further development
Analyzing the current trading chart, we see FOMO in all its manifestations, where the quote has already managed to rise above the mark of 1.1300, and the volatility already exceeds the average daily norm by half. In fact, this is a kind of emotional move that does not pay attention to the technical factor, including the overheating of long positions. It is worth considering that ignoring overheating only leads to an aggravation of the consequences, and you need to be prepared for this. Now we still have the final peak on the way to the area of 1.1400/1.1440, which signals a possible change in the trend.
In terms of emotional mood, we see that the lost profit syndrome has not gone away, and hamsters are still pouring positions into an emotional glass.
Detailing the available period every minute, we see that the round of long positions was set at 10:00, where during this time we have already managed to touch the value of 1.1337.
In turn, traders expected a similar development at the breakdown of the maximum on December 31. I am sure that many are sitting in long positions. The most important thing is not to sit in them.
It is likely to assume that the emotional move will soon slow down, where a pullback below 1.1300 will be formed, which will signal the closing of long positions in this period. Until this happens, we should not rule out a further move towards 1.1400/1.1440.
Based on the above information, we will output trading recommendations:
- Buy positions are already underway, where the fixations were at the level of 1.1300, and subsequent interaction points are located in the area of 1.1400-1.1440.
- Sell positions are considered when the trading interest changes, just at the time of fixing long positions. It all depends on where we are at the moment. For example, if this moment comes now, the entry is made lower than 1.1295.
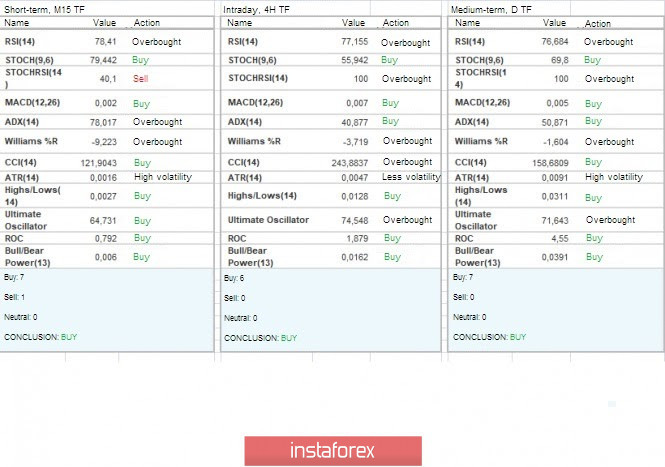
Indicator analysis
Analyzing different sectors of timeframes (TF), we see that the indicators of technical instruments are subject to the same FOMO syndrome, where there is a buy signal relative to all the main time intervals.
Volatility for the week / Volatility Measurement: Month; Quarter; Year.
The volatility measurement reflects the average daily fluctuation from the calculation for the Month / Quarter / Year.
(March 6 was based on the time of publication of the article)
The volatility of the current time is 127 points, which is already higher than the daily average by 122%. It is likely to assume that a slowdown will occur soon, where the rest of the day will be expressed in a movement in the available amplitude.
Key levels
Resistance zones: 1.1440; 1.1550; 1.1650*; 1.1720**; 1.1850**; 1.2100.
Support zones: 1.1300; 1.1180; 1.1080**; 1.1000***; 1.0950**; 1.0850**; 1.0775*; 1.0700; 1.0500***; 1.0350**; 1.0000***.
* Periodic level
** Range level
*** Psychological level
***** The article is based on the principle of conducting a transaction, with daily adjustments.


