


Trend analysis (Fig. 1).
Today, after retesting down a retracement level of 85.4% equivalent to 1.2795 (blue dashed line), a downward movement is possible with the target at the lower fractal of 1.2726 (blue dashed line).
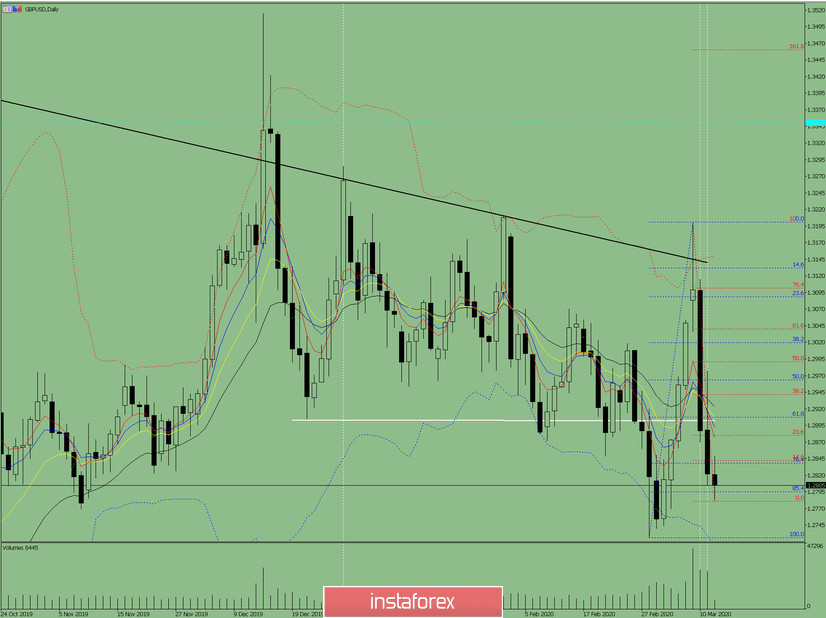
Fig. 1 (daily chart).
Comprehensive analysis:
- Indicator analysis - down;
- Fibonacci levels - down;
- Volumes - down;
- Candlestick analysis - down;
- Trend analysis - down;
- Bollinger Lines - down;
- Weekly schedule - down.
General conclusion:
Today, the price may continue to move down.
An unlikely scenario: from a pullback level of 85.4% equivalent to 1.2785 (blue dashed line) work up with a target of 1.2880, a pullback level of 23.6% (red dashed line).


