


Trend analysis (Fig. 1).
Today, it is possible to test the retracement level of 38.2% - 1.2571 (red dashed line), when moving upwards. Upon reaching this level, there is a possible continuation of the upward movement with the target of 1.2691, a pullback level of 50.0% (red dashed line).
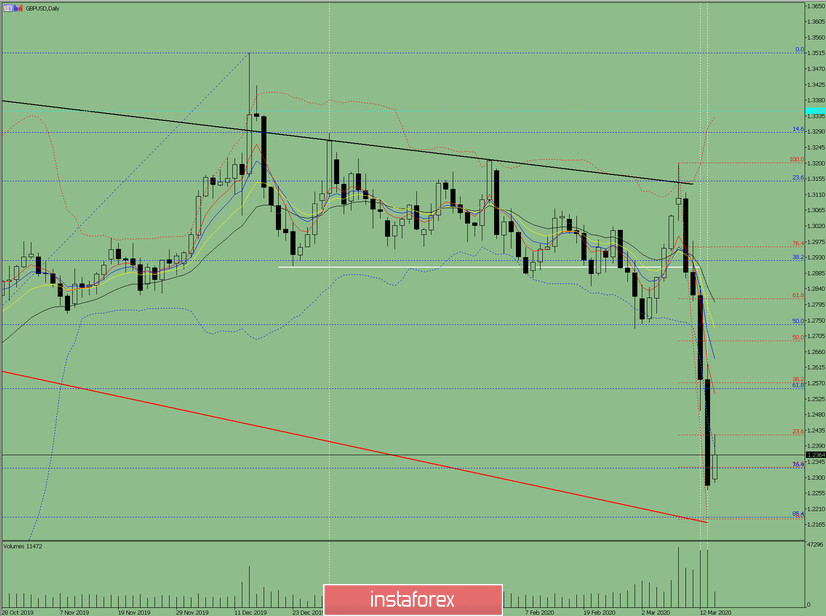
Fig. 1 (daily chart).
Comprehensive analysis:
- Indicator analysis - down;
- Fibonacci levels - up;
- Volumes - down;
- Candlestick analysis - up;
- Trend analysis - down;
- Bollinger lines - down;
- Weekly schedule - up.
General conclusion:
Today, the price may begin to move backward.
Unlikely scenario: from a pullback level of 23.6% - 1.2423 (red dashed line), work down with the target at the lower fractal 1.1950 (blue dashed line).


