


Trend analysis.
This week, the price will move upwards, towards the goal of 1.1196. There's a pullback level of 23.6% (blue dotted line). After reaching it, working upwards to the goal of 1.1331, the resistance line (red bold line), is also possible.
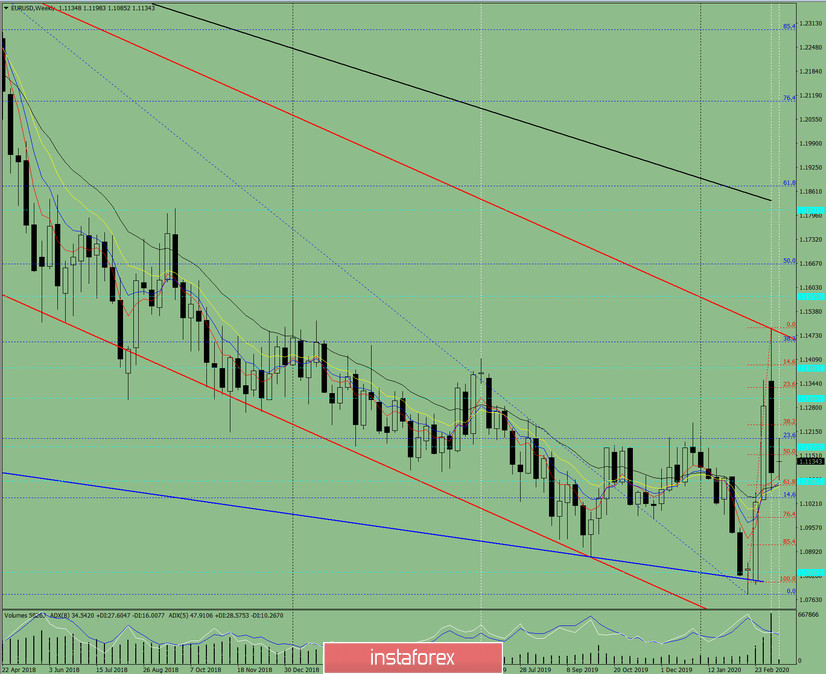
Fig 1 (weekly chart).
Complex analysis:
- Indicator analysis: up;
- Fibonacci levels: up;
- Volumes: up;
- Candlestick analysis: neutral;
- Trend analysis: down;
- Bollinger bands: up;
- Monthly chart: up.
The analysis indicates an upward movement.
The overall result of calculating the weekly candle of the EUR / USD pair: the price will have an upward trend this week, with the absence of the first lower shadow of the weekly white candle (Monday – up) and the absence of the second upper shadow (Friday – up).
Unlikely lower scenario: from the pullback level of 61.8% - 1.1072 (red dotted line), the price will move downwards to the lower target of 1.0984 – the pullback level of 76.4% (red dotted line).


