


The pair, having strayed from the resistance line of the downward channel last week, moved down, passed through 9 figures according to fundamental analysis, and then broke the pullback level of 76.4% - 1.2352. This week, the price will most likely pull back up.
Trend analysis.
This week, the price can pull back to reach a retracement level of 23.6% - 1.2484 (blue dashed line), and if this line is reached, we can further work up with a target of 1.2620 which is a pullback level of 38.2% (blue dashed line).
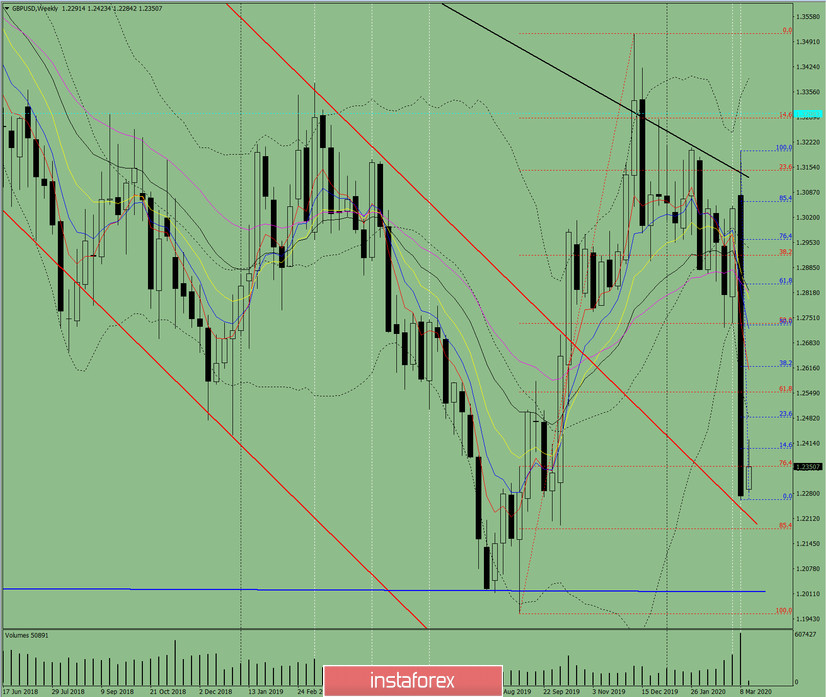
Fig. 1 (weekly schedule).
Comprehensive analysis:
- indicator analysis - up;
- Fibonacci levels - up;
- volumes - down;
- candlestick analysis - up;
- trend analysis - up;
- Bollinger lines - down;
- monthly chart - down.
The conclusion of a comprehensive analysis is the upward movement.
The overall result of calculating the candle of the GBP / USD currency pair according to the weekly chart: the price of the week will most likely have an upward trend with the absence of the first lower shadow of the weekly white candlestick (Monday - up) and the presence of the second upper shadow (Friday - down).
The first upper target 1.2484 is a pullback level of 23.6% (blue dashed line)
An unlikely lower scenario: working down with the first target 1.2262 - lower fractal (blue dashed line) from a pullback level of 14.6% - 1.2400 (blue dashed line).


