


GBP/USD
Analysis:
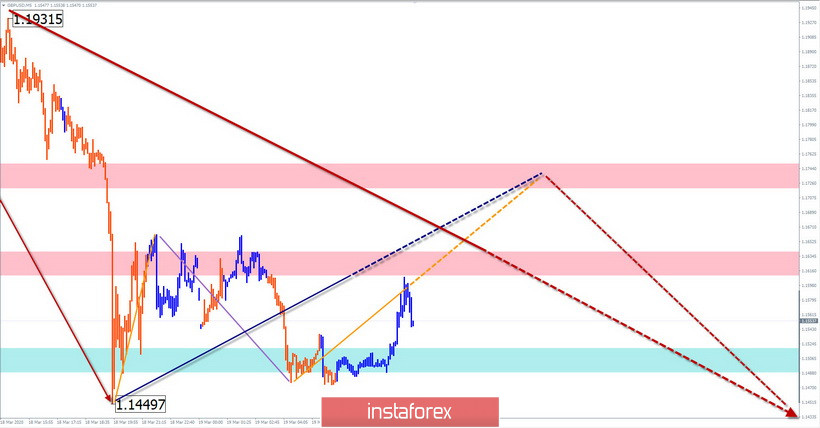
The downward wave dominating the chart of the British pound from December 13 continues its formation. The level of intermediate support was insufficient to start the wave correction. Over the past 2 days, the price has dropped to the next support zone, now on a daily scale. Since yesterday, the small TF reversal pattern has been developing upwards.
Forecast:
It is unlikely that the current support zone can be immediately pushed down by the price without working out an intermediate correction. Today, a flat move of the pair is expected, mainly with an ascending vector. In the event of a breakout of the nearest resistance zone, a price increase may lead quotes to the area of long-term resistance.
Potential reversal zones
Resistance:
- 1.1720/1.1750
- 1.1610/1.1640
Support:
- 1.1520/1.1490
Recommendations:
Trading on the British pound market today is possible only if you have in-session experience. When purchasing, you should be careful. In areas of calculated resistance zones, it is recommended to track the signals of your trading systems for sale.
USD/JPY
Analysis:
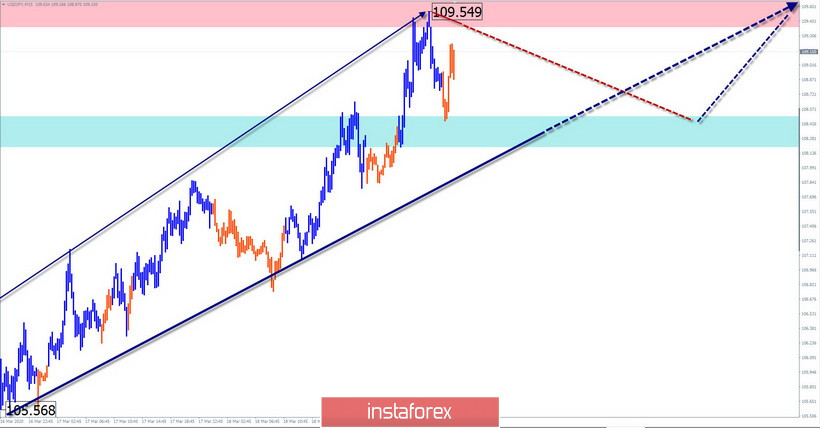
On March 9, a new stage of weakening of the Japanese yen's price positions relative to the US dollar began. The trend is long-term, since the current wave level of movement has already approached the scale of the H4 timeframe. The price has reached the intermediate resistance zone.
Forecast:
Today, the most likely movement of the yen price in the lateral plane. The scale of the resistance zone is not sufficient to form a full-fledged correction, so a return to the ascending rate is possible at the end of the day.
Potential reversal zones
Resistance:
- 109.40/109.70
Support:
- 108.50/108.20
Recommendations:
It is safer to skip the pair's expected corrective movements today. In the area of the support zone, it is recommended to track the signals of your trading systems to buy the instrument.
USD/CHF
Analysis:
On March 9, the Swiss franc chart changed its trend. The potential for an upward movement is estimated not lower than the daily scale of the chart. The price is approaching the lower limit of the weekly scale resistance zone.
Forecast:
In the next trading sessions, it is likely that the rise will end and the beginning of a corrective decline will begin. The most likely range of price fluctuations is limited to the nearest counter zones. The resumption of exchange rate growth is not expected until tomorrow.
Potential reversal zones
Resistance:
- 0.9770/0.9800
Support:
- 0.9660/0.9630
Recommendations:
Trading on the franc market today can be risky. The potential for purchases has been exhausted, and the conditions for sales have not been created. The optimal tactic is to refrain from entering the pair's market during the pullback, with the search for buy signals at its end.
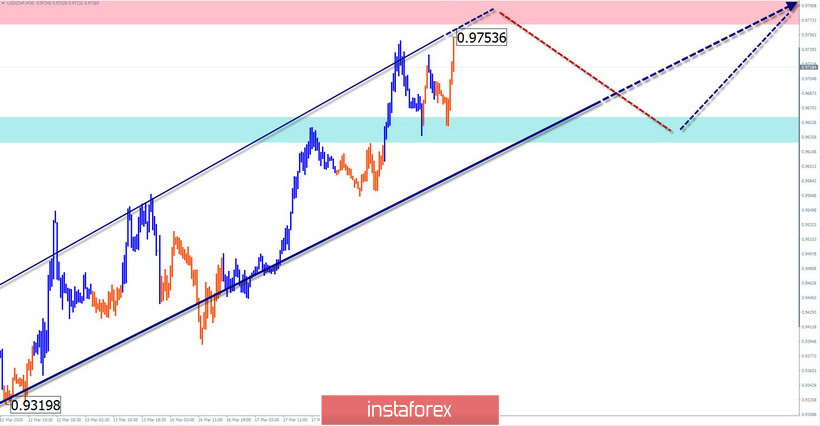
Explanation: In the simplified wave analysis (UVA), waves consist of 3 parts (A-B-C). The last incomplete wave is analyzed. The solid background of arrows shows the formed structure and the expected movements - dotted.
Note: The wave algorithm does not take into account the duration of the tool movements in time!


