


Hello, traders!
At its meeting today, the Swiss National Bank (SNB) decided not to make changes to monetary policy and to keep the main interest rate at minus 0.75%.
At a time when many of the world's leading central banks are easing monetary policy and lowering rates to prevent negative consequences from COVID-19, the SNB did not consider it necessary to lower the rate even lower. It is already at a very low level.
Well, let's analyze the charts of the dollar/franc currency pair, and since this tool is not considered so often, let's start with the weekly timeframe.
Weekly
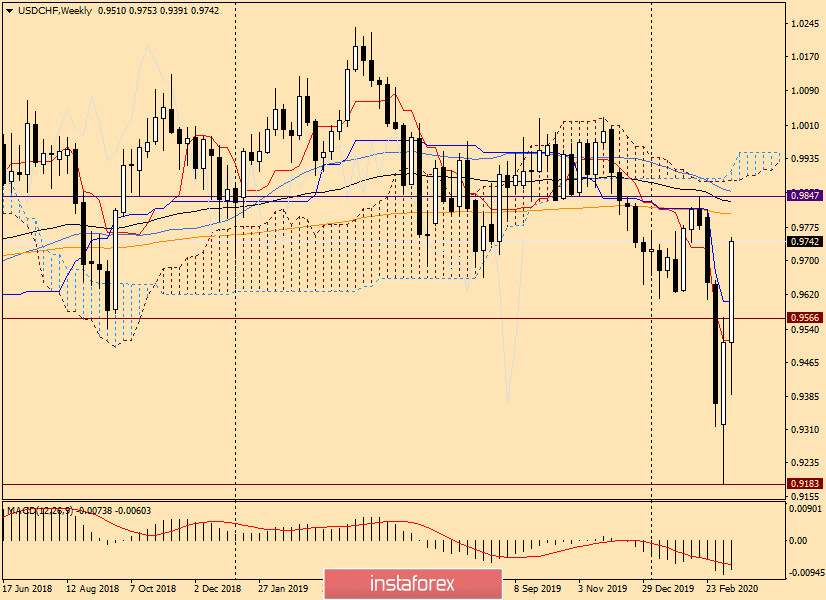
There is a clear reversal of course. At the auction of the past five days, bears for USD/CHF tried to continue to put pressure on the quote, and at first, they succeeded. However, at the level of 0.9183, the pair found strong support and began to recover, and at a fairly intensive pace. As a result, trading on March 9-13 ended at 0.9511, that is, above the important psychological and technical level of 0.9500.
As you can see, the above pair was not allowed by the Tenkan line of the Ichimoku indicator. However, at the current five-day trading session, the pair is trading significantly higher than Tenkan, near 0.9720. Very strong growth, which is difficult to call a corrective pullback. Most likely, we are seeing a change in the trend.
If this assumption is correct and the dollar/franc continues its upward trend, the nearest growth targets will be 200 exponential moving average, which passes at 0.9807, 89 EMA at 0.9834, the resistance level at 0.9847, and 50 simple moving average, which passes at 0.9858. Thus, the resistance zone on the weekly chart can be designated as 0.9800-0.9860. Judging by this timeframe, the rise of USD/CHF is likely to continue.
Daily
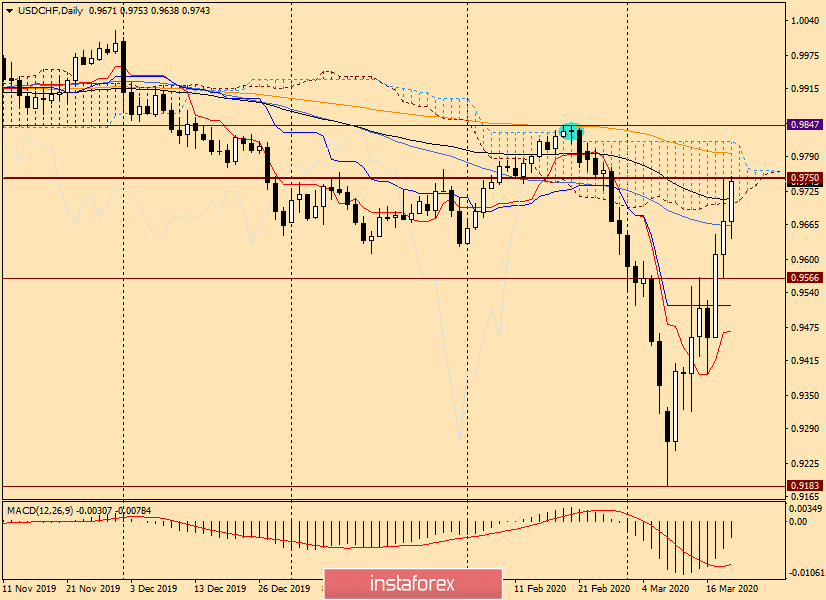
On the daily chart, the pair tries to enter the limits of the Ichimoku indicator cloud, breaking through the 89 exponential. However, even in case of success, the tasks for the bulls on this instrument can not be called solved.
In my opinion, it will be very important to break through the strong technical level of 0.9750 and gain a foothold above this mark. It's not without reason that for the second day in a row, players on a course increase fail to overcome this obstacle. But that's not all.
After a true breakdown of 0.9750, you will need to break through 200 EMA and bring the price up from the Ichimoku indicator cloud. Then there should be a breakdown of the sellers' resistance at 0.9847. The longer-term goals of the bulls can be discussed only after fixing above the broken resistance level of 0.9847.
Based on this time period, you should track the price behavior in the area of 0.9750-0.9850. If you see bearish reversal candles here, you should try opening short positions.
H4
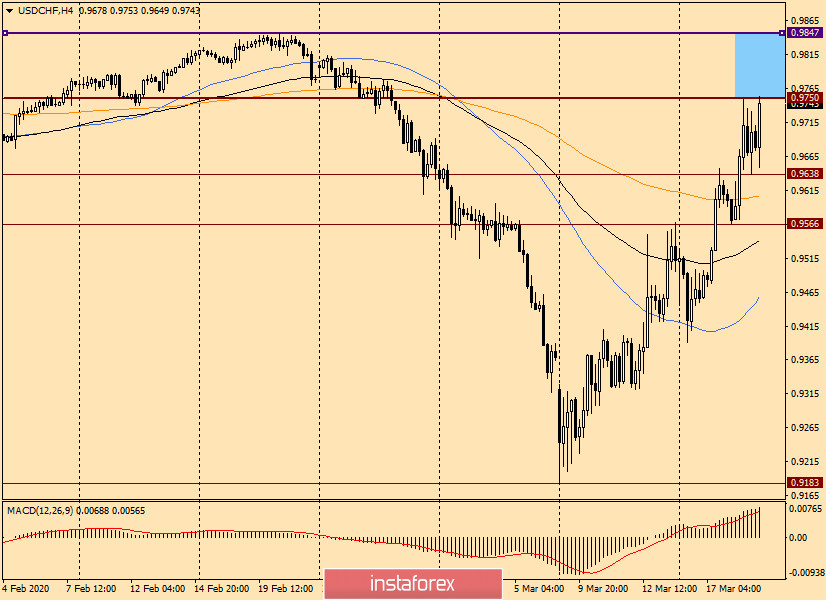
On the 4-hour chart, the change of bearish to bullish moods is clearly visible. Most likely, the resistance level of 0.9750 will be passed, but whether it will be possible to gain a foothold above this level will become clear in the very near future.
If a reversal model or candlestick analysis models appear in the blue-squared zone, you should try selling with a stop above 0.9850 and the nearest targets in the area of 0.9750-0.9700.
At the moment, the relevance of purchases remains, which are better to open after corrective rollbacks to the levels of 0.9650 and 0.9600.
Good luck!


