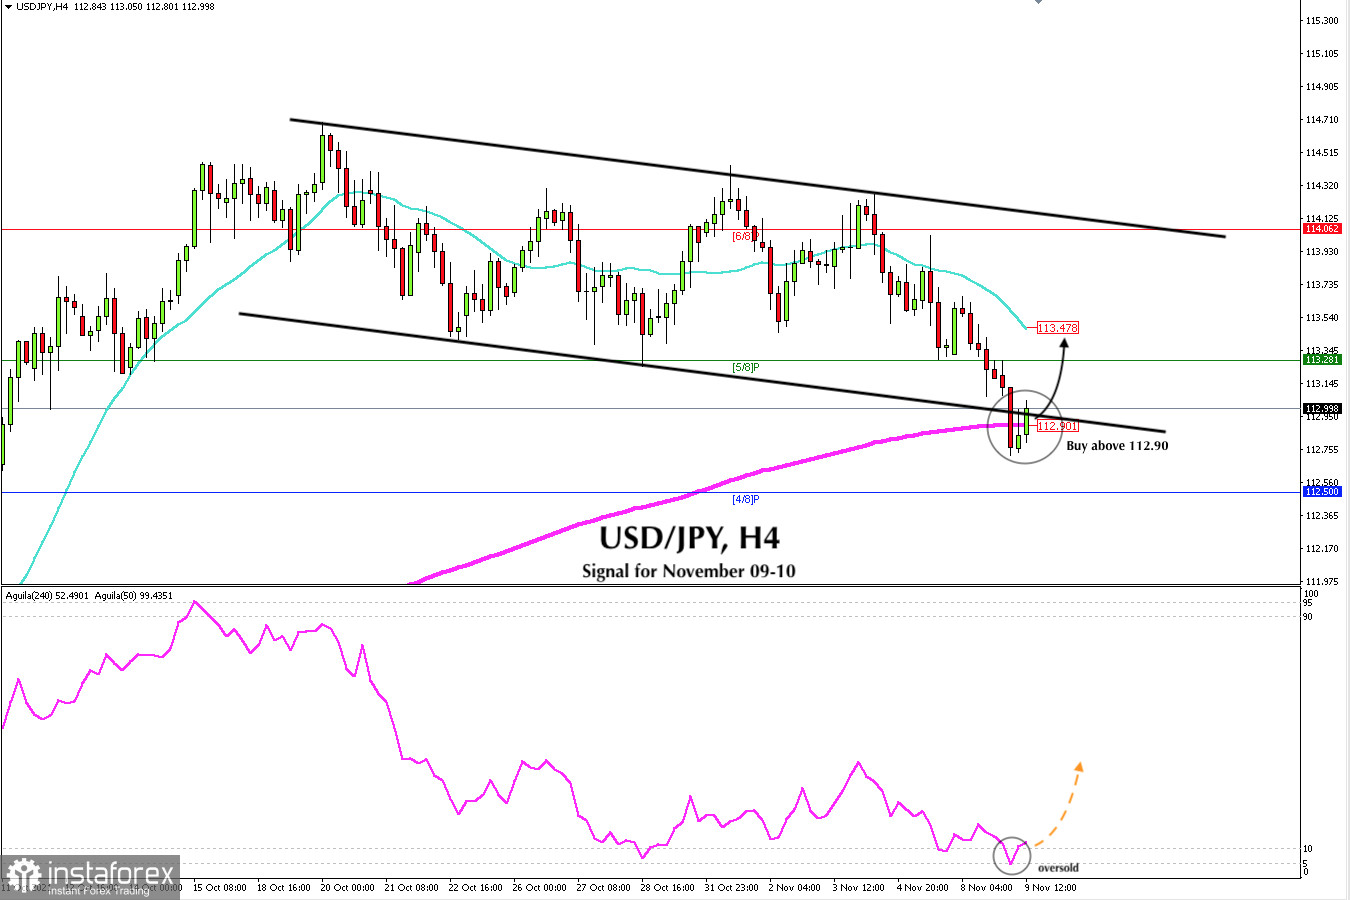
The USD/JPY pair in the European session fell towards the 200 EMA zone located at 112.90. It was trading for a few hours below this zone and now, ahead of the opening of the American market, it is bouncing above this moving average. It could be a good sign that it could reach the 21 SMA around 113.47.
Investors' cautious approach supported the Japanese yen acting as a safe haven asset and put some downward pressure on the pair until it reached the price levels of October 11, that is the low of 112.71. Like the Japanese Yen, Gold is another safe haven asset, and yesterday we saw that it reached the 1,828 level, which showed that investors were anticipating any data from the Fed before the end of the month.
According to the 4-hour chart, it is seen that the Japanese yen has been consolidating within a downtrend channel since October 8 and on November 8 it reached the key zone of the 200 EMA. Above this level, an upward movement is expected to the area of 114.06, which represents the top of the bearish channel. A sharp break above this level could enable the upward movement to 7/8 around 114.84.
On the contrary, a daily close and fixation below the 200 EMA could be the start of a bearish scenario and we could see a pullback towards the 4/8 murray level around 112.50. If this support is broken, a drop to the area of 111.71 located at 3/8 murray could occur.
On the other hand, the eagle indicator on November 8 reached the 5-point level that represents extreme oversold coditions. It is possible that in the next few hours there will be a technical rebound. We may take advantage of the situation, only if the pair remains above 112.90. In this case, it will give us a chance to buy with targets at 113.47 and 114.06.
The market sentiment report for today, November 9, shows that there are 65.63% of operators who are selling this USD/JPY pair. This is a negative sign and we could see an upward movement in the next few days towards the level of 114.06 and up to 114.84.
Our forecast for the next few hours is to buy above the 200 EMA as long as it also remains above the lower line of the downtrend channel with profit taking at 113.47 and 11.406. The eagle indicator is giving bullish signal and supports our strategy of a technical rebound.
Support and Resistance Levels for November 09 - 10, 2021
Resistance (3) 113.70
Resistance (2) 113.53
Resistance (1) 113.30
----------------------------
Support (1) 112.71
Support (2) 112.50
Support (3) 112.35
***********************************************************
A trading tip forUSD/JPY for November 09 - 10, 2021
Buy above 112.90 (EMA 200) with take profit at 113.47 (SMA 21) and 114.07 (6/8), stop loss below 112.55.


