


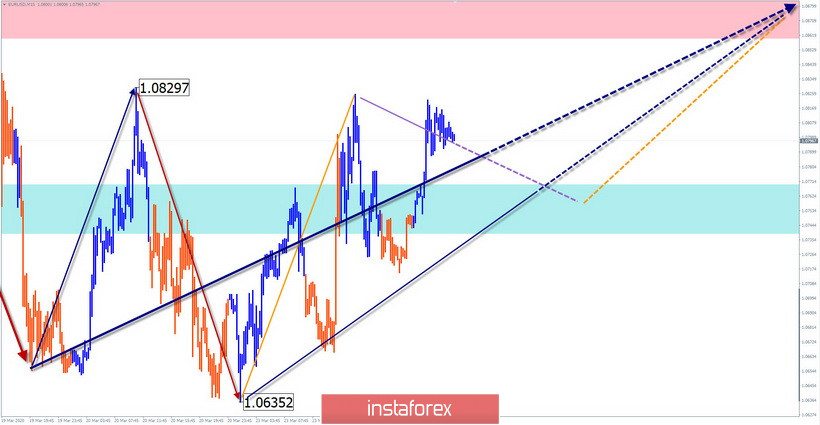
EUR/USD
Analysis:
On the chart of the European currency on March 9, a large-scale downward wave started. The price has reached the potential reversal zone. Since the end of last week, a price rebound has been forming. The probability of an upward correction is high.
Forecast:
The general flat nature of the price movement is expected in the next trading sessions. In the first half of the day, you should wait for an upward course. A return to the main direction is likely at the end of the day.
Potential reversal zones
Resistance:
- 1.0860/1.0890
Support:
- 1.0770/1.0740
Recommendations:
In the near future, intraday trading will be relevant to the pair's market. When purchasing, it is wiser to reduce the lot. Sell signals should be tracked in the area of the calculated resistance zone.
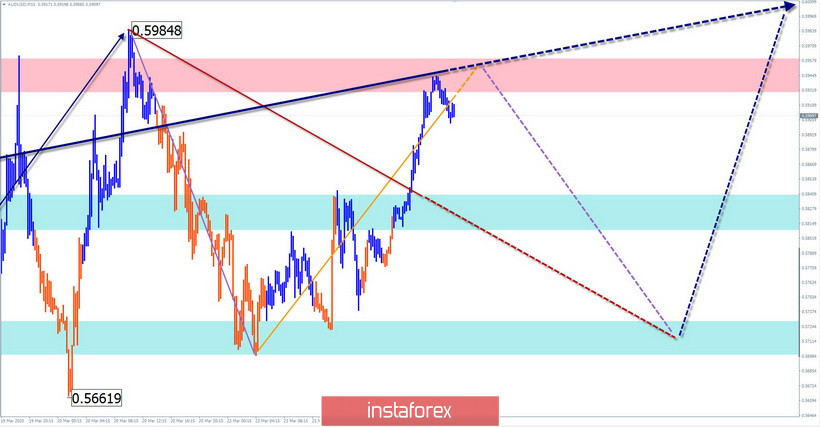
AUD/USD
Analysis:
The main wave on the chart of the Australian currency is bearish, counting from the beginning of 2018. The price has reached a strong support zone. A small-scale reversal model is formed on the chart. It should give rise to an upward wave. In recent days, it has been developing a correction.
Forecast:
In the coming day, the price is expected to move in a side corridor, between the nearest counter zones. In the European trading session, short-term pressure on the resistance zone is possible. A breakout of the nearest support is likely at the end of the day or tomorrow.
Potential reversal zones
Resistance:
- 0.5930/0.5960
Support:
- 0.5840/0.5810
- 0.5730/0.5700
Recommendations:
Today in the market, trading within the framework of the sessions is recommended and I agree with the expected sequence. The focus should be on selling signals.
GBP/JPY
Analysis:
On the pair's chart, the rising wave from March 18 has a pronounced reversal potential. Its scale is already close to the level of the H1 timeframe. Since the beginning of the week, the price forms a correction. Previously, it can reach the starting point of the entire wave.
Forecast:
Today, we expect a mostly downward trend in the price movement. A short-term pressure on the resistance zone is possible before lowering. It is unlikely that the lower support limit will breakthrough during the current day.
Potential reversal zones
Resistance:
- 128.40/128.70
Support:
- 127.20/126.90
Recommendations:
Today, short-term deals are possible during trading sessions. The lot is more reasonable to reduce. The best tactic is to refrain from trading during the decline, and track buy signals at the end of the correction.
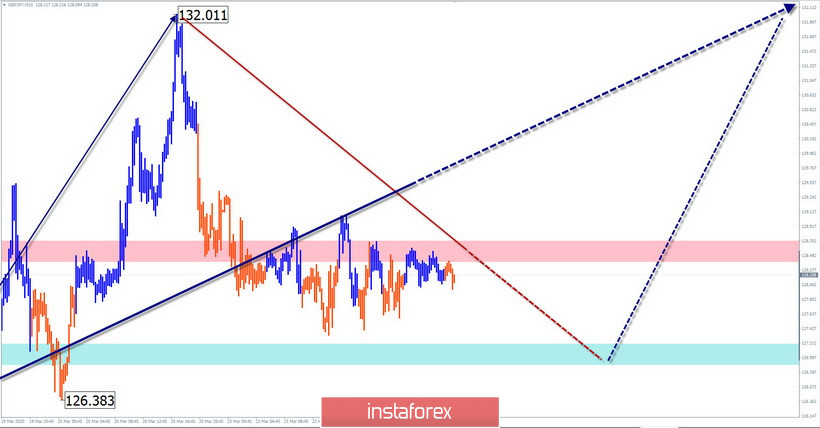
Explanation: In the simplified wave analysis (UVA), waves consist of 3 parts (A-B-C). The last incomplete wave is analyzed. The solid background of arrows shows the formed structure and the expected movements - dotted.
Note: The wave algorithm does not take into account the duration of the tool movements in time!


