


Hello, dear traders!
COVID-19, which continues to spread around the world, leads to changes in sentiment in the currency market. Thus, the Japanese yen, which is a traditional safe-haven currency, has been showing a decline against the US dollar for the third week in a row.
At the same time, despite a significant two-time reduction in the main interest rate of the Fed, the "American" turned very sharply and is growing stronger against the Japanese currency.
Weekly
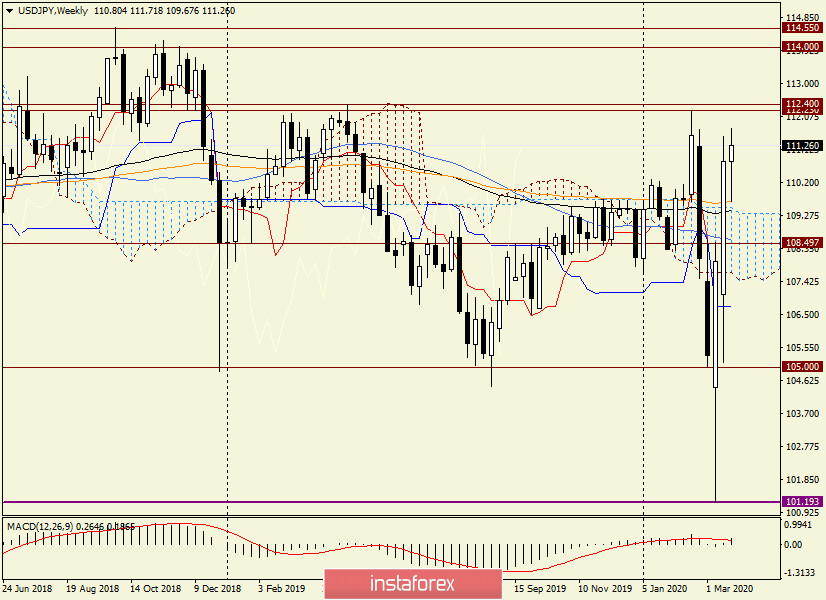
As can be clearly seen on the weekly chart, after reaching 101.19, the USD/JPY pair found strong support and started an impressive rise. At the moment of writing, the pair is trading near 111.40 and, apparently, is preparing to test an important and strong resistance zone of 112.23-112.40 for a breakdown.
If this area is passed and the dollar/yen is fixed above 112.40, the road will open to an equally important and significant resistance area of 114.00-114.55. I believe that the further direction of the quote will be decided here. However, the first task for the USD/JPY bulls will be to break through the price area of 112.23-112.40 and fix it higher.
If the final weekly candle appears in the form of a Doji (or one of the Doji varieties), a signal will appear about the extinction of the upward momentum and the likely change of the upward trend to a downward one.
Due to the continuing spread of the coronavirus epidemic, the market situation can change at any time - whether it is a week, a day, or even an hour. For those who rely on weekly timeframe signals to open positions, I recommend waiting for the current candle to form and then making a decision to enter the market.
Daily
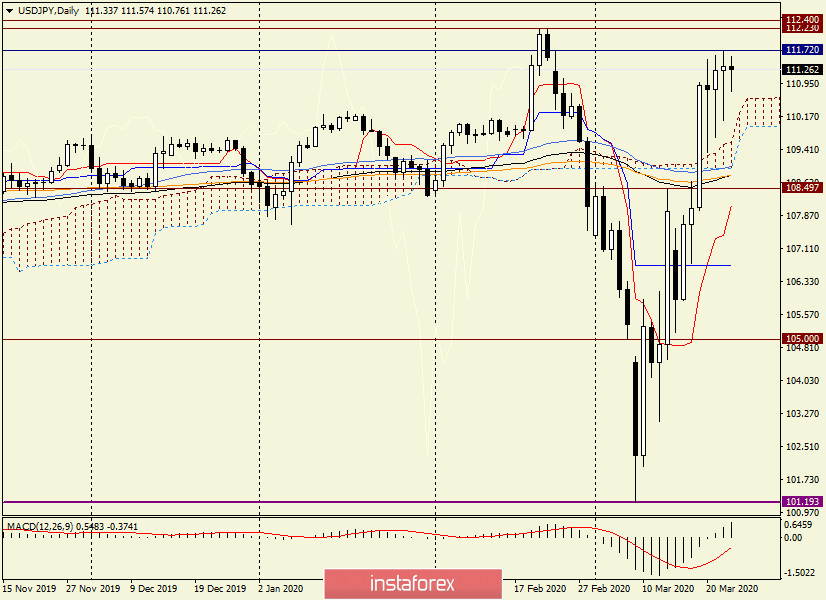
But on the daily chart, the situation is already changing. This is indicated by candles that began to form starting from March 20. The current daily resistance is indicated by the level of 111.72, and only its breakdown with the session closing higher will signal the readiness of bulls for this instrument to storm the price area of 112.23-112.40. At the same time, I do not exclude that as a result of strong upward momentum, the pair will overcome not only 111.72, but also 112.23 and 112.40.
If there is another Doji-type candle at the end of today's trading, there will be more grounds for a reversal in the south direction from the current values. I think that the main thing now is not to rush and wait for the clearest signals about the further direction of the quote. However, we must admit that any comments on COVID-19, as well as the announcement of the next measures to support economic stability by the world's leading central banks, can radically change the situation and "bury" even the most pronounced technical signals. Such a possible development of events should be taken into account and do not neglect the placement of protective stop-loss orders.
H4
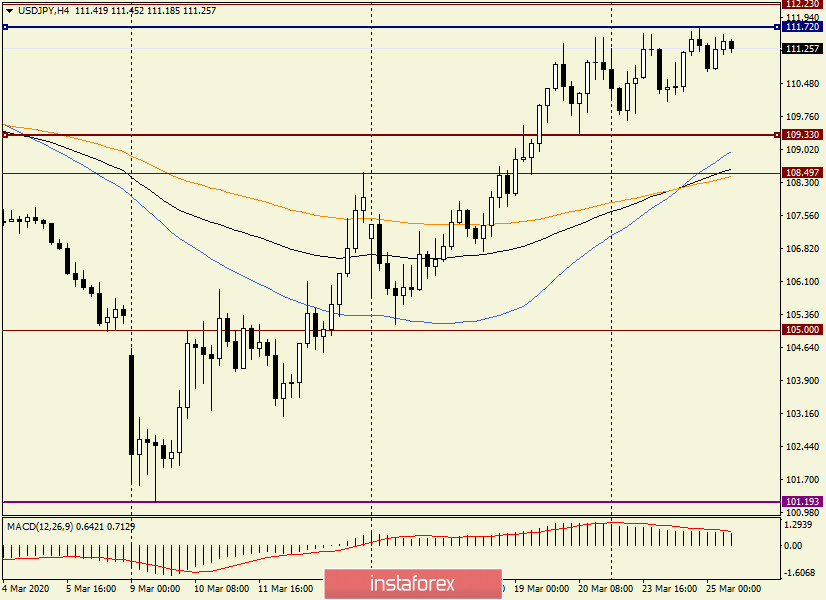
On the 4-hour chart, the situation is quite interesting. As you can see, starting from February 19, the pair is trading in the range of 109.33-111.72. In such cases, it is logical to assume that the exit from the created range can indicate the further direction of the price. However, this situation, in my opinion, stands apart, since the already mentioned strong resistance zone of 112.23-112.40 passes above 111.72. Below the lower limit of the range of 109.33, the used moving averages (50 MA, 89 EMA, and 144 EMA) have gathered, which can provide support.
Thus, judging by the technical picture on H4, the exit from the range of 111.72-109.33 to either side may be false. To open purchases, I suggest waiting for a true breakdown of 112.40 and, at a rollback to this level, buy with the goals of 113.00, 113.20, 113.50 and, possibly, 114.00.
To open short positions, it is better to wait for another reversal candle on the daily chart and (or) break through the mark of 108.40 (144 EMA on H4) and try selling on the pullback to this level. At the moment, the USD/JPY pair has such thoughts.
Good luck!


