


EUR/USD
Analysis:
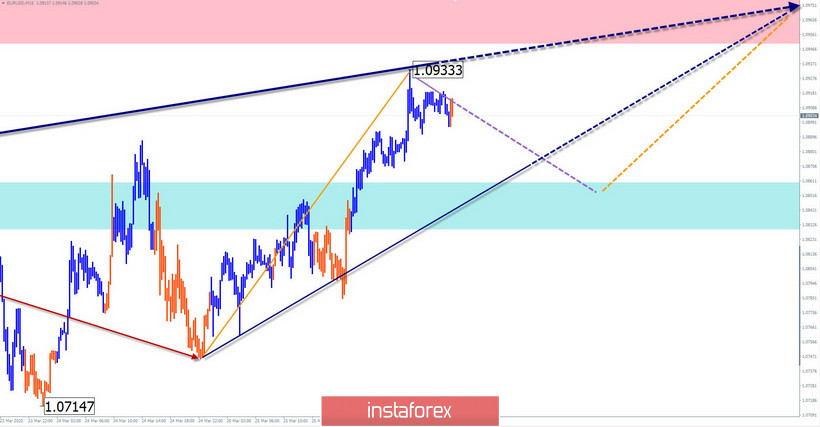
On the chart of the European currency, a downward wave has been developing since March 9. The wave level of the movement exceeded the scale of the hourly timeframe. From the support zone, the price has been forming a corrective rise for the past week. The wave has entered its final phase.
Forecast:
In the coming day, the main direction of the price movement remains the course to the "north" of the chart. In the next session, a short-term decline is possible, no further than the calculated support.
Potential reversal zones
Resistance:
- 1.0950/1.0980
Support:
- 1.0860/1.0830
Recommendations:
Supporters of long-term deals should refrain from entering the pair's market until the entire correction is completed. In the near future, purchases with a reduced lot will be relevant.
AUD/USD
Analysis:
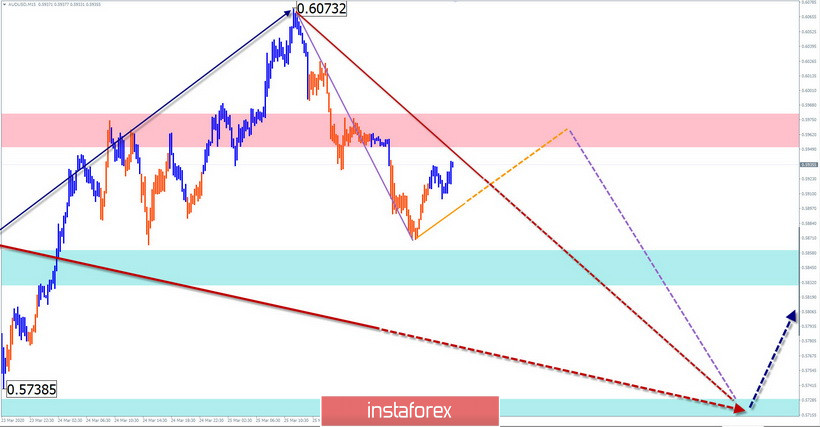
The upward movement that started on March 19 on the Australian dollar chart has a high potential. In the future, the wave will move to the scale of the medium-term trend. A correction has been forming in the wave structure for the past week.
Forecast:
In the coming day, the pair's market is expected to see a general downward trend in the price movement. There is a high probability of a breakout of the current support level today.
Potential reversal zones
Resistance:
- 0.5950/0.5980
Support:
- 0.5860/0.5830
- 0.5740/0.5710
Recommendations:
Until the appearance of clear signals of a change in the trend rate, the priority direction for trading transactions remains sales. The trading lot in them is more reasonable to reduce. The optimal tactic is to wait for the correction to complete and make purchases of the pair.
Explanation: In the simplified wave analysis (UVA), waves consist of 3 parts (A-B-C). The last incomplete wave is analyzed. The solid background of arrows shows the formed structure and the expected movements - dotted.
Note: The wave algorithm does not take into account the duration of the tool movements in time!


