


Last week, the pair broke away from the support line of 1.0665 (red bold line) and moved upwards, almost testing the pullback level of 61.8% - 1.167 (red dotted line). This week, from the level of 1.1139 (closing of the last weekly candle), the price may start moving downwards.
Trend analysis:
The price may roll back downwards this week, with the first target at 1.1040. The pullback level is 23.6% (blue dotted line). After reaching it, the movement may continue, so the next target will be 1.0964 – a pullback level of 38.2% (red or blue dotted line).
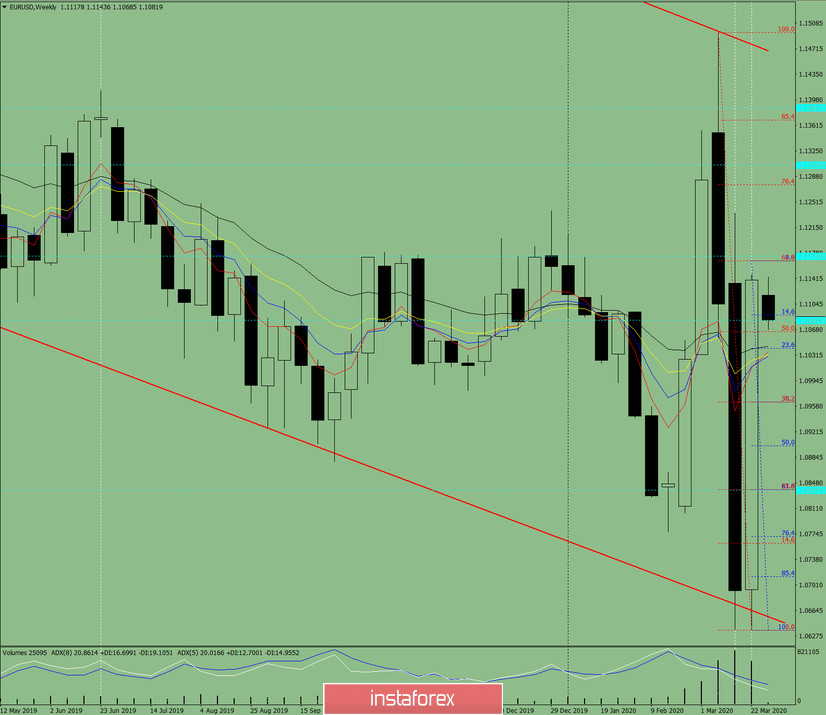
Fig. 1 (weekly chart).
Complex analysis:
- Indicator analysis - down;
- Fibonacci levels - down;
- Volumes - down;
- Candle analysis - neutral;
- Trend analysis - up;
- Bollinger bands - up;
- Monthly chart-up.
The analysis concludes a downward movement.
According to the overall result of the calculation of the EUR/USD candles in the weekly chart: the pair will probably have a downward trend, with the absence of the first upper shadows of the weekly black candles (Monday – down), and the presence of the second lower shadow (Friday – up).
An unlikely scenario: from 1.1042 - a pullback level of 23.6% (blue dotted line), the pair will move upwards with the target of 1.1276 – a pullback level of 76.4% (red dotted line).


