


Trend analysis (Fig. 1).
Today, the pair will continue to move down from the level of 1.2418 (closing of Friday afternoon's candle) with the first target at 1.2258, a retreating level of 23.6% (blue dashed line). Upon reaching this line, an upward movement is possible with a target of 1.2518, a retracement level of 61.8% (blue dashed line). From this level, a continuation of the upward movement is possible.
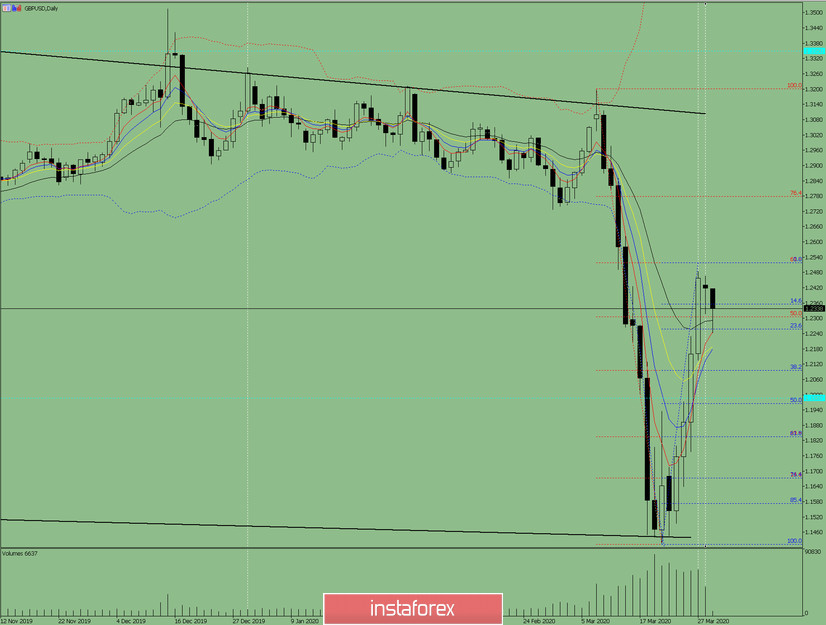
Fig. 1 (daily chart).
Comprehensive analysis:
- Indicator analysis - down;
- Fibonacci levels - down;
- Volumes - up;
- Candlestick analysis - down;
- Trend analysis - up;
- Bollinger Lines - up;
- Weekly schedule - up.
General conclusion:
Today, a continuation of the down movement is possible with the first target of 1.2258, a retracement level of 23.6% (blue dashed line). Upon reaching this line, the upward movement is likely to continue.
Unlikely scenario: from a retracement level of 23.6% - 1.2258 (blue dashed line) work down with a target of 1.2096, a retracement level of 38.2% (blue dashed line).


