


Trend analysis (Fig. 1).
Today, from the level of 1.2398 (closing of yesterday's candle) the pair may begin to move down with the first target of 1.2238, a retracement level of 23.6% (blue dashed line). Upon reaching this level, the continuation of the downward work is with the target of 1.2081, a retracement level of 38.2% (blue dashed line).
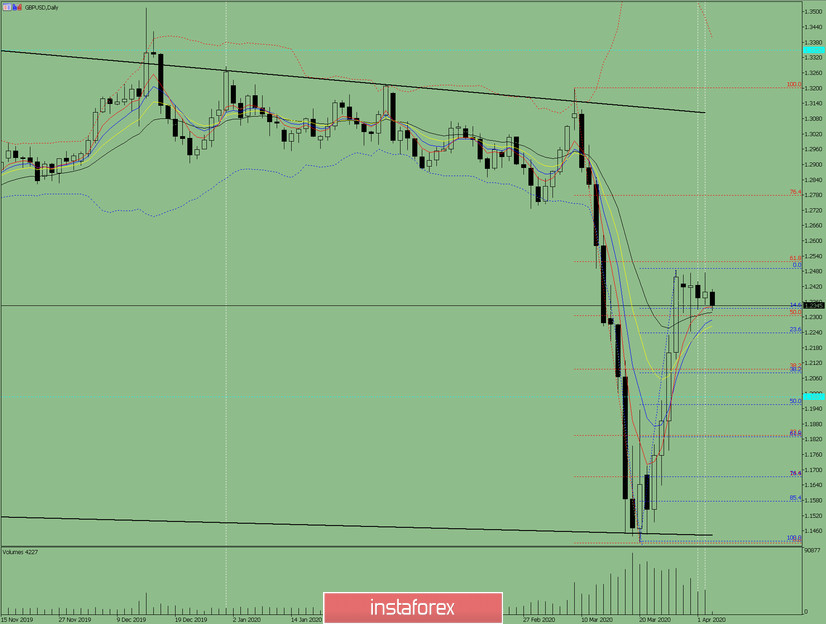
Fig. 1 (daily chart).
Comprehensive analysis:
- Indicator analysis - down;
- Fibonacci levels - down;
- Volumes - down;
- Candlestick analysis - neutral;
- Trend analysis - up;
- Bollinger Lines - up;
- Weekly schedule - down.
General conclusion:
Today it is possible to move down with the first target of 1.2238, a retracement level of 23.6% (blue dashed line). Upon reaching this level, continued downward work with a target of 1.2081, a retracement level of 38.2% (blue dashed line).
An unlikely scenario: from a retracement level of 14.6% - 1.2333 (blue dashed line), work up with a target of 1.2518, a retracement level of 61.8% (red dashed line).


