


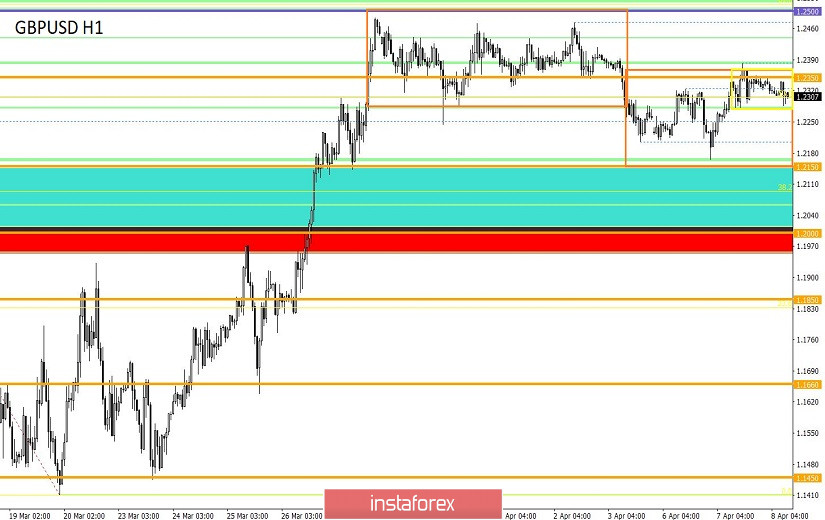
From the point of view of complex analysis, we continue to record the characteristic side movement with a wide amplitude, and now let's talk about the details. As early as one week and half, the quote conditionally does not move anywhere, having a wide side range, where the focus was on the frames 1.2280 // 1.2380 / 1.2480 (1.2500) at first, and after that, there was a shift to the boundaries of 1.2150 / 1.2350 (+/- 30 pip). The magnitude of the fluctuations is important, but with a general review of the trading chart, it will be seen that the quote is still at the peak of an earlier inertial move, where there were no fundamental changes.
Here, a variety of theories began to arise in all this oscillation and now, let's consider them:
1. Graphical analysis: traders, considering the daily periods,began to notice the shape of the continuation of the "FLAG" move. The outlines may be there, only across the postulates of the analysis itself. Considering the patterns on the daily periods, it is worthwhile to be aware that the market changes daily due to the strong external background, and sometimes every hour, but it is not necessary to apply graphical analysis on daily periods at the current time.
2. Flat bias: traders assume that the slowdown itself carries a possible change in the structure of the earlier inertia, and just a shift of this slowdown to a lower level is considered a possible signal of an early appearance of a round of short positions.
3. Consequences and risks: investors clearly understand that the COVID-19 virus will cause significant damage to the economy of many countries, and when risks and panic surpasses, investors run to protective assets, and this is the dollar.
Of the above theories, the most relevant are options 2 and 3.
Analyzing the past trading day , we see that the value of 1.2166, which arose during the continuation of the downward impulse of April 6, became the minimum. The start of the reverse move also arose during the period of the Pacific-Asian session and moved to the European one, where the entire downward surge on April 6 was played. The maximum value was the mark of 1.2383.
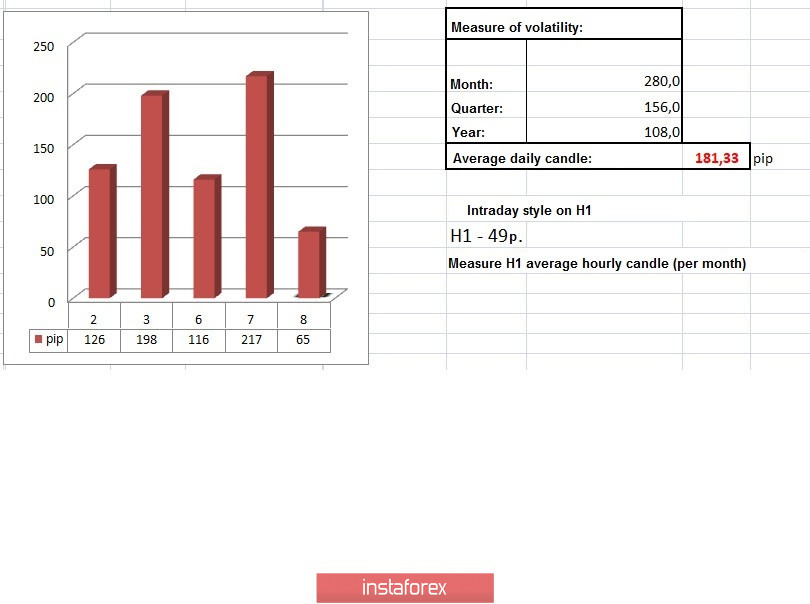
In terms of volatility, we see a characteristic acceleration, where the increase was 19% relative to the average daily indicator.
Details of volatility: Monday - 165 points; Tuesday - 245 points; Wednesday - 172 points; Thursday - 358 points; Friday - 359 points; Monday - 144 points; Tuesday - 271 points; Wednesday - 676 points; Thursday - 354 points; Friday - 522 points; Monday - 267 points; Tuesday - 296 points; Wednesday - 333 points; Thursday - 452 points; Friday - 352 points; Monday - 148 points; Tuesday - 227 points; Wednesday - 108 points; Thursday - 126 points; Friday - 198 points; Monday - 116 points; Tuesday - 217 points. The average daily indicator, relative to the dynamics of volatility is 181 points [see table of volatility at the end of the article].
It can be noted that market dynamics have been accelerating for the second month.
Considering the trading chart in general terms [the daily period], we see that there are no fundamental changes, the quotes fluctuates at the peak of inertia, as if preparing for a further jump.
The news background of the past day contained data on JOLTS open vacancies in the United States, where they recorded a decrease from 7.012 million to 6.882 million.
In terms of the general information background, we see that the situation with coronavirus is not improving, the number of registered cases of infection in the world is still keeping pace, and the total figure is already 1,429,939.
The COVID-19 virus has already dealt an undeniable blow to the global economy, but the main consequences are ahead of us.
Regarding negotiations between England and Brussels on trade relations after Brexit, the process is underway. According to representatives, Prime Minister Boris Johnson will not affect the stages of negotiations.
"As for the negotiations themselves, there was a series of technical contacts last week at the level of the two teams on some clarifications. Yesterday, the EU representative also held consultations with the British negotiator David frost. Of course, contacts continue this week," the representative of the European Commission said at a briefing.
There was also information that there will be a connection next week between the main negotiators Michel Barnier and David Frost, where they will discuss a calendar of future stages of negotiations in order to advance the negotiation process.
Let me remind you that Michel Barnier and David Frost were diagnosed with coronavirus earlier, and the European side actively promoted the position of prolonging the transition period, but did not receive a response from England.
Today, in terms of the economic calendar, we do not have statistics worth paying attention to. Nevertheless, external background will continue to play a key role in the market.
Further development
Analyzing the current trading chart, we see a temporary fluctuation of the quote within the range of 1.2280 / 1.2350 (1.2380), which is a variable range and if the downward sentiment is maintained, the lower border will fall soon. In fact, the main framework in this oscillation will be the values of 1.2150 / 1.2350 (+/- 30 pip), this is the same bias that we wrote about at the beginning of the article.
In terms of emotional background, we still see a high speculative coefficient, which intensifies against the background of an external news flow, particularly the COVID-19 virus.
It can be assumed that the fluctuation in the range of 1.2280 / 1.2350 (1.2380) does not last long, where it is worthwhile to carefully analyze the boundaries for breakdown. Developing within these frameworks is considered less relevant, so only one method is selected, that is, to breakdown.
Based on the above information, we derive trading recommendations:
- We consider selling positions in case of fixing a price higher than 1.2275, with the prospect of a movement to 1.2220-1.2170.
- We consider buying positions higher than 1.2380, with the prospect of a movement to 1.2450.
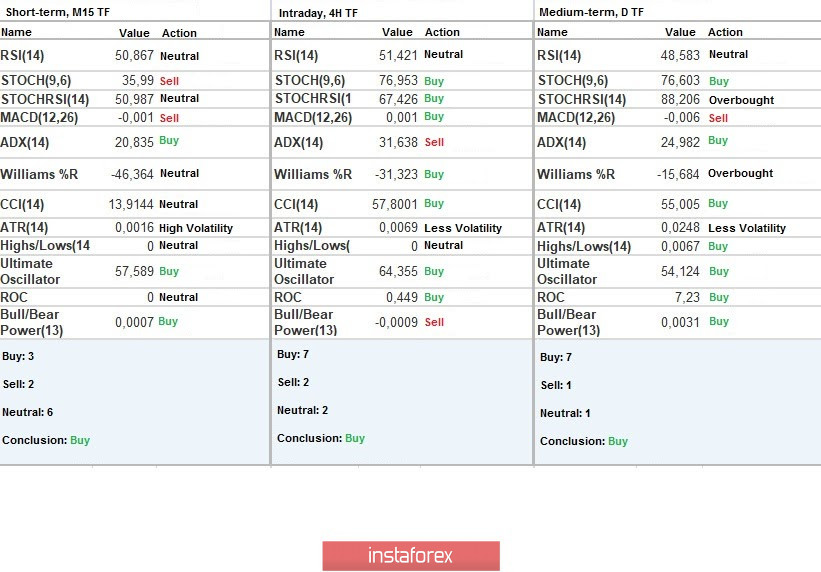
Indicator analysis
Analyzing a different sector of time frames (TF), we see that technical tools in the minute and hour periods are focused on fluctuations in the ranges, having a variable buy signal. Meanwhile, daily periods work at an earlier inertia, giving a buy signal.
Volatility per week / Measurement of volatility: Month; Quarter; Year
Measurement of volatility reflects the average daily fluctuation, calculated for Month / Quarter / Year.
(April 8 was built taking into account the publication time of the article)
The volatility of the current time is 65 points, which is considered extremely low activity for having a piece of time. It is likely to assume that acceleration will occur during the breakdown of the range of 1.2280 / 1.2350, which will multiply the indicator into half.
Key levels
Resistance zones: 1.2350 **; 1.2500; 1.2620; 1.2725 *; 1.2770 **; 1.2885 *; 1.3000; 1.3170 **; 1.3300 **; 1.3600; 1.3850; 1.4000 ***; 1.4350 **.
Support Areas: 1.2280 (1.2240); 1.2150 **; 1.2000 *** (1.1957); 1.1850; 1.1660; 1.1450 (1.1411); 1.1300; 1.1000; 1.0800; 1.0500; 1.0000.
* Periodic level
** Range Level
*** Psychological level
**** The article is built on the principle of conducting a transaction, with daily adjustment


