


Trend analysis (Fig. 1).
On Friday, the market from the level of 1.2460 (yesterday's closing of candlestick) will try to break up the upper fractal of 1.2484 (blue dashed line) and, if successful, it will continue to move up, with the target of 1.2518 - a pullback level of 61.8% (red dashed line). If this level is broken upward, the upward trend will continue with the target of 1.2779 - a pullback level of 76.4% (red dashed line).
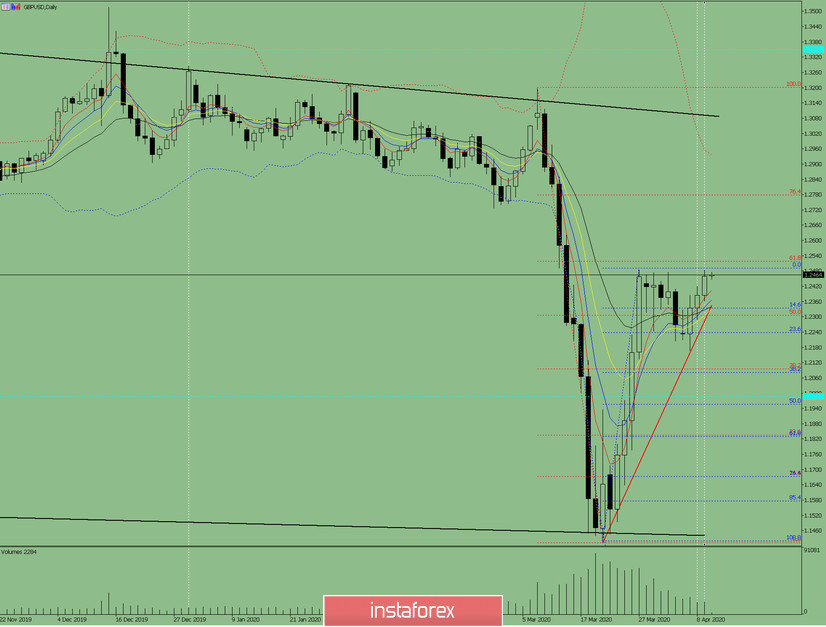
Fig. 1 (daily chart).
Comprehensive analysis:
- indicator analysis - up;
- Fibonacci levels - up;
- volumes - up;
- candlestick analysis - down;
- trend analysis - up;
- Bollinger Lines - up;
- weekly schedule - up.
General conclusion:
Today, the price will try to continue its upward movement with the target of 1.2518 - a pullback level of 61.8% (red dashed line).
An unlikely scenario: working down from the level of 1.2484 (blue dashed line), with the target of 1.2238 - a pullback level of 23.6% (blue dashed line).


