


EUR/USD
Analysis:
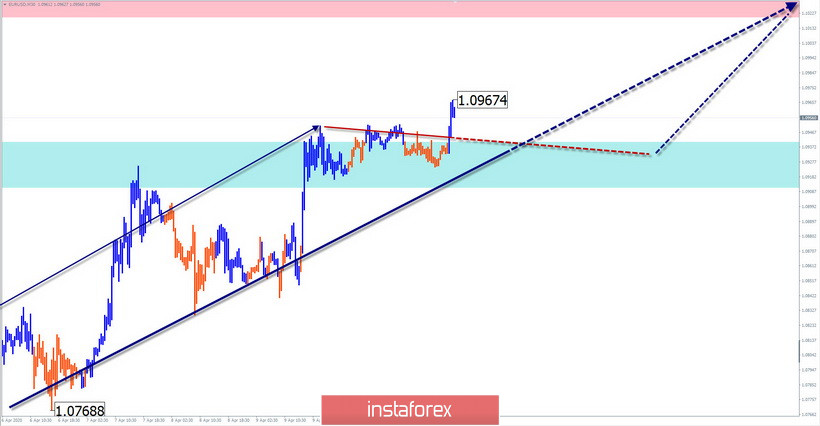
The last current wave on the chart of the European currency is the rising wave from March 20. Its structure traces the first parts (A-B). The downward correction that started on April 9 is formed as a stretched plane.
Forecast:
Today, expect the end of the current correction and the resumption of the price increase. A short-term puncture of the lower border of the support zone is not excluded. The start of the last expected phase is more likely by the end of the day.
Potential reversal zones
Resistance:
- 1.1020/1.1050
Support:
- 1.0940/1.0910
Recommendations:
Sales of the euro today is very risky, therefore, it is not recommended. The main attention is given to the signals of entering long positions.
AUD/USD
Analysis:
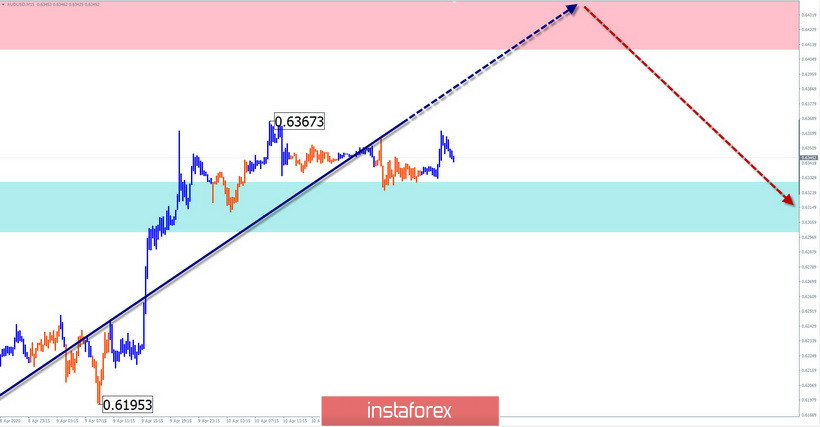
The upward wave of the Australian dollar, which began on March 19, reached the lower limit of a powerful zone of potential large-scale reversal. There are no signals of change in the rate on the chart yet.
Forecast:
Today, the pair's chart is expected to attempt to pressure the resistance zone. In the first half of the day, "sideways" is possible. Activation of the pair can be expected in the American session.
Potential reversal zones
Resistance:
- 0.6410/0.6440
Support:
- 0.6330/0.6300
Recommendations:
Trading on the Australian dollar market today is only possible within the intraday. The potential for price growth is almost exhausted, so you need to be prepared for a sharp change in the exchange rate when buying. For sales, services have not yet been created.
GBP/JPY
Analysis:
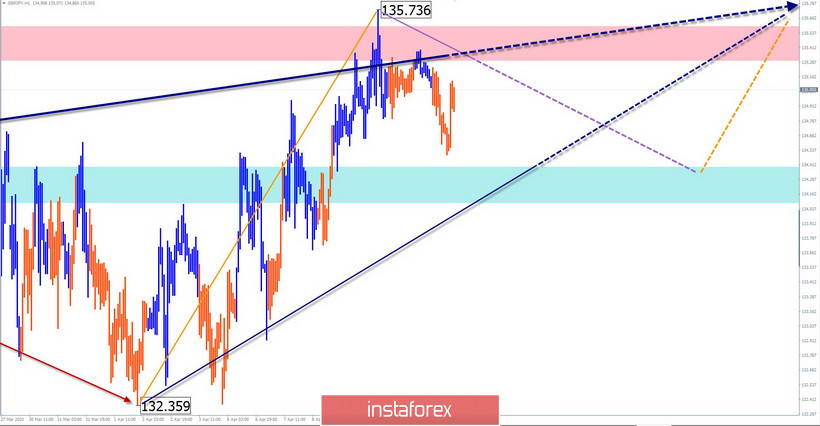
Starting on March 18, the pair's price increase refers to the weekly scale of the instrument's chart. The price moves to the nearest target zone, the lower limit of which is around 138 of the price figure. The price has reached an intermediate resistance.
Forecast:
Today, the price is expected to move in the side corridor between the nearest counter zones. After trying to pressure the resistance, it is likely to decrease further.
Potential reversal zones
Resistance:
- 135.30/135.60
Support:
- 134.40/134.10
Recommendations:
Today, trading on the pair's market is only possible with an intra-session style. Before the completion of the current correction, short-term sales from the resistance zone are possible. In the support area, it is recommended that you track buy signals.
Explanation: In the simplified wave analysis (UVA), waves consist of 3 parts (A-B-C). The last incomplete wave is analyzed. The solid background of arrows shows the formed structure, and the dotted ones show the expected movements.
Note: The wave algorithm does not take into account the duration of the tool movements in time!


