


GBP/USD
Analysis:
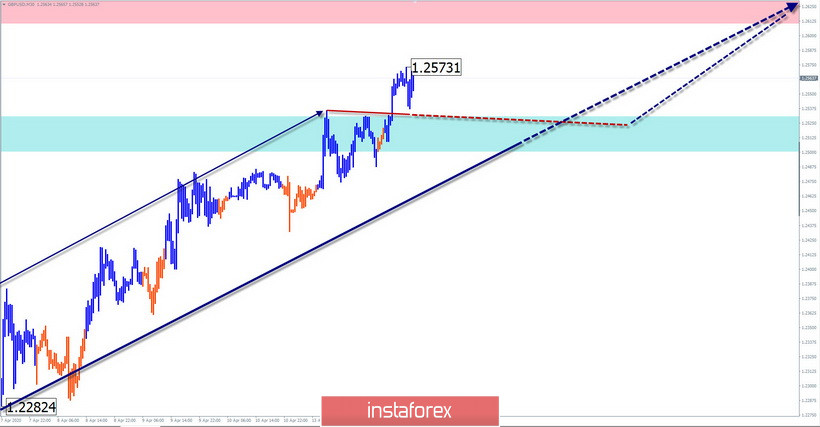
On the chart of the British pound, the formation of a bullish wave from March 18 continues. On April 3, the final part of the wave started. The lower limit of the target zone is at the beginning of the 127th price figure.
Forecast:
Today in the first half of the day, a flat mood is expected. It is possible to decrease to the area of the calculated support zone. By the end of the day, the probability of a reversal and a return to the upward course increases.
Potential reversal zones
Resistance:
- 1.2610/1.2640
Support:
- 1.2530/1.2500
Recommendations:
Selling the British pound today is risky. It is recommended to focus on searching for signals to buy the instrument.
USD/JPY
Analysis:
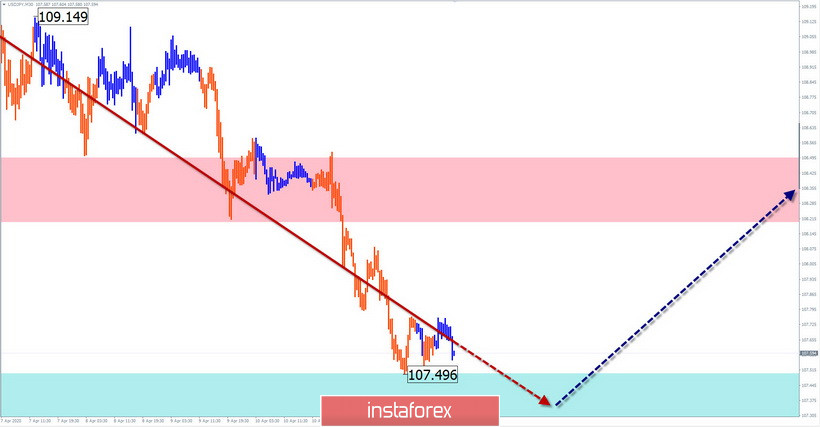
The direction of the short-term trend of the Japanese yen since March 9 is directed to the north of the price chart. Over the past 2 weeks, the price has formed the conditions for a final push up. The decline from April 6 reached the preliminary stage of completion. There are no signals of a change of course yet.
Forecast:
The decline is expected to end in the next trading sessions. Then you can wait for the formation of a reversal and the beginning of a price rise. The upper limit of the daily range limits the calculated resistance.
Potential reversal zones
Resistance:
- 108.20/108.50
Support:
- 107.50/107.20
Recommendations:
Today, trading on the pair's market is only possible with an intra-session style. It is recommended to refrain from trading until clear reversal signals appear. When purchasing, you should reduce the trading lot.
Explanation: In the simplified wave analysis (UVA), waves consist of 3 parts (A-B-C). The last incomplete wave is analyzed. The solid background of arrows shows the formed structure, and the dotted ones show the expected movements.
Note: The wave algorithm does not take into account the duration of the tool movements in time!


