


On Wednesday, the pair was moving downwards, according to the fundamental analysis. Today, the downtrend may continue. On Thursday, strong economic news is expected at 12.30 GMT (for US dollar)
Trend analysis (pic. 1).
On Thursday, the pair is likely to continue the downtrend at the level of 1.2518 (where yesterday the daily candlestick closed). The pair will try to continue to move down until it hits a pullback level of 23.6% - 1.2358 (blue dotted line). If the price breaks through this level, the continuation of the downward movement is possible with the target at 1.2176 which serves as a retracement level of 38.2% (blue dotted line). After reaching the level, the pair will start an uptrend.
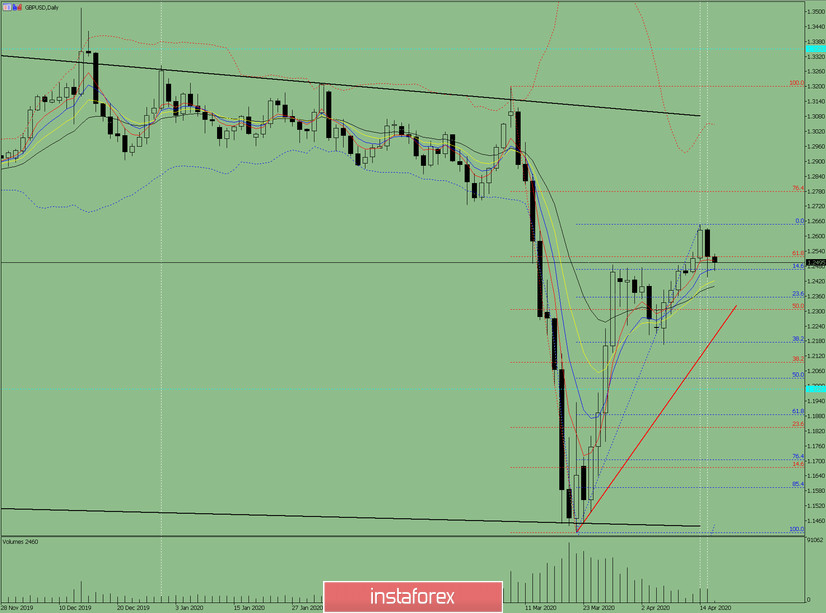
Pic. 1 (daily chart).
Comprehensive analysis:
- indicator analysis - down;
- Fibonacci levels - down;
- volumes - up;
- candlestick analysis - down;
- trend analysis - up;
- Bollinger Lines - up;
- weekly chart - up.
General conclusion:
Today, the price will try to continue to fall to the target of 1.2176 which serves as a retracement level of 38.2% (blue dotted line).
Possible scenario: from a retracement level of 14.6% - 1.2469 (blue bold line) it goes up with a target of 1.2648 which is the upper fractal (blue dotted line).


