


Good day!
At its meeting yesterday, the Bank of Canada decided to leave everything as it is and not change the parameters of monetary policy yet. Let me remind you that the main interest rate of the Bank of Canada is at the level of 0.25%. It is not necessary to reduce it to zero, especially since the negative consequences of COVID-19 for the Canadian economy are still far from clear. And oil prices have recently shown more than a serious drop, and the recently adopted OPEC+ agreement, according to some experts, will briefly support oil quotes. What is the point of oil prices? Moreover, the Canadian dollar exchange rate depends on them quite strongly, although it is more correct to say that it depended on it because recently the correlation of oil prices and CAD is not as pronounced as in the old days.
If you go back to the unfortunate COVID-19 epidemic and its negative impact on the world's leading economies, Canada's GDP for the month of March fell by as much as 9%. This is the maximum decline since 1961! However, it is worth noting that the data on Canada's GDP for March are preliminary, and the final figures may be even worse. Thus, it seems that the Canadian Central Bank has hidden a trump card up its sleeve and left a field for maneuver in the event of an even greater deterioration of the economic situation in the country.
Well, it's time to move on to the charts of the USD/CAD currency pair, and since it is analyzed once a week, let's start with the weekly timeframe.
Weekly
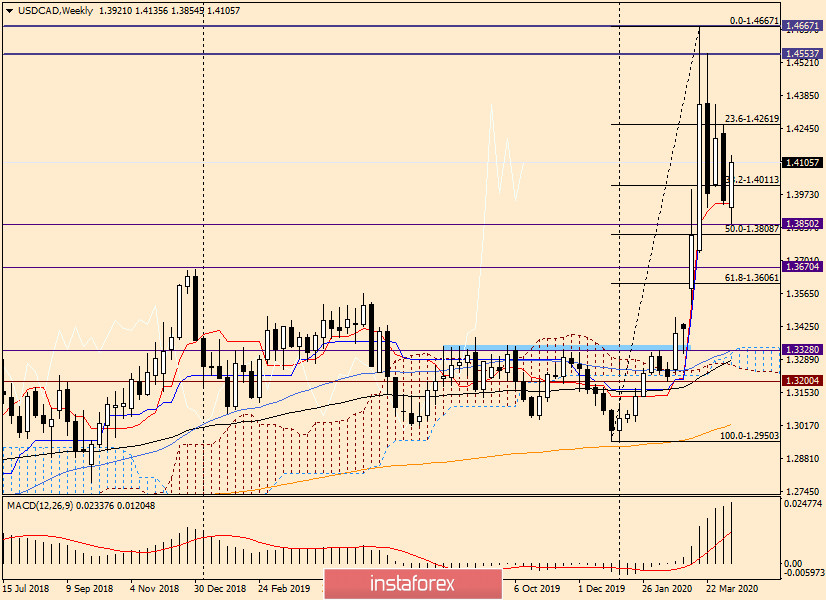
As you can see, the pair ended the last five-day trading session with a decline, at which the closing price was at 1.3949. However, the pair is already showing growth this week. This is due to how often the situation and the mood of market participants changes. Now it is difficult to find a pair in which there is a clearly expressed trend.
On this chart, please pay attention to the Tenkan line of the Ichimoku indicator, which stopped the decline last week and threw the pair up in the current weekly trading. However, before this, the flight was lower, to the level of 1.3850, where, in fact, the growth of the quote began. If the rise continues, the nearest target for this time period will be the maximum values of the previous trades at 1.4260. I would like to note that this is a fairly strong price level, so it serves as a strong and important resistance for a reason. If the USD/CAD bulls manage to pass it, the road to the area of 1.4350 will open. The area of 1.4555-1.4666 will be the further reference points for possible growth.
It is also worth noting that the US dollar is in demand and has again become perceived by investors as a safe-haven currency. This means that the bears are unlikely to be able to radically change the situation. To do this, you need to level out all current growth, move the exchange rate to negative territory, lower it below the support of 1.3850 and end the weekly trading under this level. Frankly, this is not an easy task.
Daily
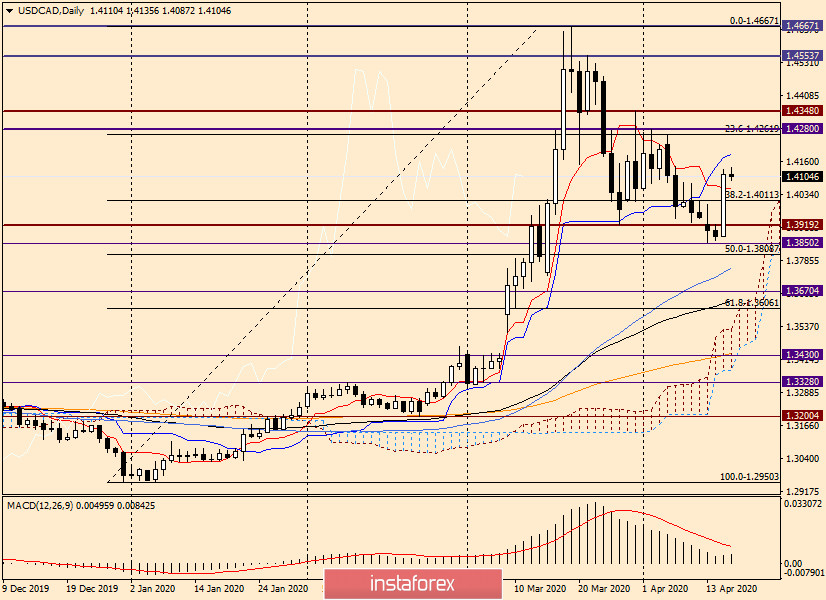
In yesterday's trading, the pair rose significantly and ended Wednesday's session between the Tenkan and Kijun lines, which are, respectively, support and resistance. We can assume that a true breakout of one of these lines will indicate the subsequent direction of USD/CAD.
H4
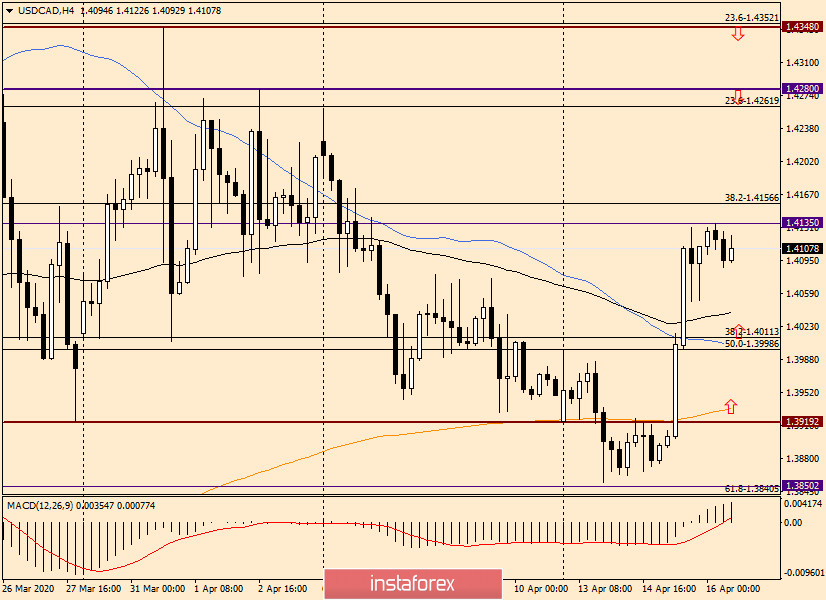
For trading recommendations on USD/CAD, I use a four-hour chart, taking into account the situation on the other two timeframes considered. I will immediately note that although the situation is ambiguous, this week I am more inclined to expect a growth in the quote.
I suggest that you consider buying when you go down to the areas of 1.4040-1.4000 and 1.3935-1.3880. For those who trade on a breakout, buy on the breakout of the highs of today's Asian session 1.4135.
Sales are better viewed at more attractive prices, after rising to strong resistance levels of 1.4260, 1.4280 and 1.4330.
Good luck!


